
 The accounts payable shared services center (SSC) of a large Ohio-based healthcare system completed a Six Sigma operational enhancement and reporting project. This case study reviews the course of the project which endeavored to establish standard invoice processing times and develop an ongoing system for monitoring how well those standards are met.
Over the last three years, the SSC processed an average of 738,000 invoices a year for payment. The largest segment of its operations was, and continues to be, purchase order (PO)-based invoices. In 2013, PO invoices accounted for 56 percent of the total processing volume for the SSC.
As a means to help address the high volume of PO invoices being processed, the SSC established a daily production quota. The apportionment was determined by taking the estimated total number of PO invoices to be processed in a given month divided by the number of working days within that month. This number was then divided by the number of assigned employees. The formula used to calculate the quota was a frequent complaint of SSC employees and supervisory staff because it failed to recognize the variability in processing time when multiple line items were present on a PO invoice.
Project Objectives
Amid calls for change, the SSC embarked on a Six Sigma project in mid-2013 that contained three objectives.
- Establish a standard time range for completion based upon the total number of line items on a PO invoice.
- Determine the process time for an invoice and whether that time fell below, within or above an established standard time range (also based upon the number of line items on each PO invoice).
- Develop a comprehensive operations report that displayed employee processing times measured against standard time ranges.
Database Evaluation
Within days of the project’s kick-off, the systems analyst for the SSC evaluated the accounts payable application used with PO invoices. The findings revealed the application’s database design was unable to separate PO invoices by total number of line items or to capture the total processing time expended by the employees who worked on the invoices. Discussions between the SSC project team and the developers of the application led to the conclusion that the best long-term solution was to make modifications to the database. Outside developers were contracted, and the database was modified to pull in all necessary data and make it readily accessible.
Data Analysis
Fourth quarter 2013 data was exported from the database into Microsoft Excel by structured query language (SQL) code written into Microsoft Access. The exported data, referred to as raw data by the project team, was presented in three columns. These columns contained the name of the employee, the total number of line items, and total time, in seconds, for each PO invoice processed. The project team copied the content of the columns into Minitab to perform data analysis. Despite being confident that the transactional raw data possessed a non-normal distribution, the project team performed a graphical summary on the response variable, processing time.
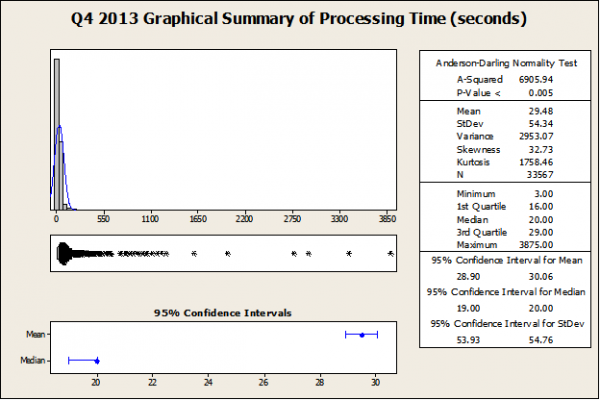
The Anderson-Darling statistic, with its p-value being lower than the chosen significance level of 0.05, confirmed the assumption that the data did not follow a normal distribution. This cued the project team to evaluate various nonparametric tests and determine which of these tests were the most appropriate going forward. An important factor in this decision was the wide variance in processing times. The graphical summary displayed a range of 3 seconds to 3,875 seconds. The project team needed a nonparametric test that was effective against outliers and errors in data. After a thorough review, the decision was made to use the Mood’s Median Test.
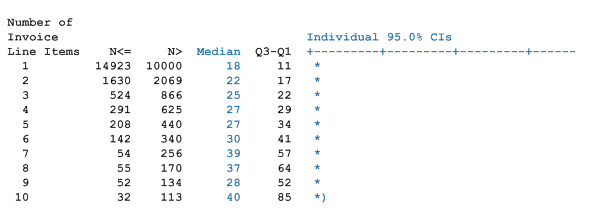
With the nonparametric test selection now behind them, the project team focused its attention on acquiring an accurate understanding of the effect the total number of line items had on actual processing time of a PO invoice. Again using the fourth quarter 2013 raw data, the project team carried out a Mood’s Median Test. The outcome of the test revealed that the 33,567 PO invoices consisted of 77 separate groups of invoices possessing the same number of line items. Further, the project team found that 33,924, or 98 percent, of the PO invoices encompassed the first ten invoice groups.
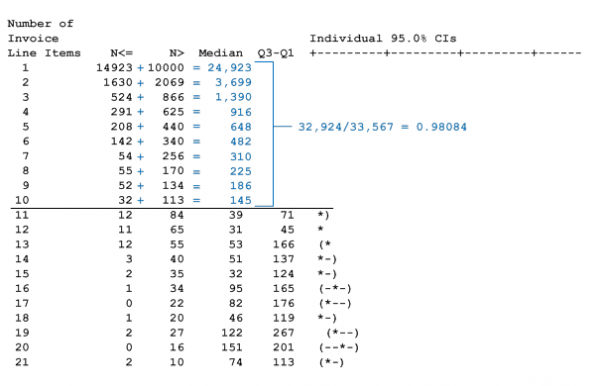
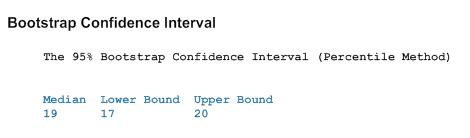
Due to the high percentage of invoices in those first ten invoice groups, SSC management decided that standard time ranges would include only those first ten groups. The project team next needed a statistical tool to help identify the standard range of processing times specific to each invoice group. Because of the ability to provide an upper and lower bound, the confidence interval was the instrument of choice. Obtaining a useful confidence interval within Minitab’s available nonparametric tools, however, gave the project team an additional challenge. While the Mood’s Median Test produced the required median information for each invoice group, the corresponding confidence interval failed to provide a usable range as it does not include lower and upper bounds.
The solution was Minitab’s bootstrap macro. The macro calculates nonparametric confidence intervals by using bootstrap methods code, which is a statistical technique used for making certain kinds of statistical inferences and involves a relatively simple procedure repeated so many times that the technique is heavily dependent upon computer calculations. To apply the macro, the project team had to identify input data, the number of iterations to be used in estimating a confidence interval and the significance level. With processing time as the input data, iteration volume at 1,000 and a significance level of 0.05, the bootstrap macro was performed on the first invoice group – PO invoices with one line item.
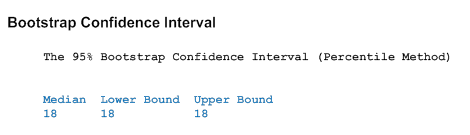
With 24,923 data points, the bootstrap macro was unable to provide any separation between the upper and lower bounds. To address this issue, the project team had to reduce the volume of data points being calculated. This was accomplished in a two-step process:
- Calculate an appropriate sample size. The data point figure of 24,923, substituting as a population number, was input into an online sample size calculator. The result was a sample size of 378.
- Randomly select and segregate 378 of the first invoice group’s processing times. To achieve this function Microsoft’s Random Sampler was employed. The project team subsequently copied the 378 processing times into Minitab and re-performed the bootstrap macro.
The bootstrap macro was utilized on the remaining nine invoice groups. To further broaden the distance of upper and lower bounds for invoice groups 2 through 4, the project team again used the same two-step process.

At the end of this analysis, a standard processing time range for each distinct invoice group had been successfully constructed. This meant that the project team had realized the first of the project’s three goals (establish a standard time range for completion based upon a PO invoice’s total number of line items).
The remaining two objectives – the ability to determine an employee’s elapsed processing time and whether that time fell below, within or above an established standard time range and the development of an all-inclusive operations report – were determined to be mutually dependent. This conclusion guided the project team to seek added assistance from the systems analyst.
Developing a Time Analysis Report
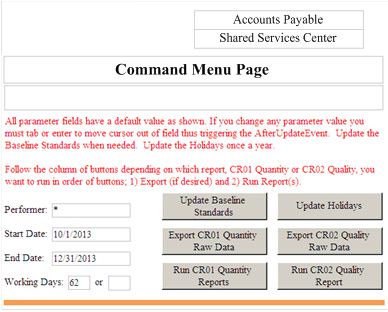
As discussions began, the project team laid out the requirements for a time analysis report. The contents of the report needed to include the standard time ranges by invoice group, including median numbers, names of employees, median processing time of each employee by invoice group, and a color scheme applied to an employee’s processing time when compared to the standard time range. In addition, the project team wanted the user of the report to be able to designate a date range and either run the report or export the raw data into Microsoft Excel. The conversations that followed contained debate over content, format, coding, application strengths and weaknesses, and completion date. In the end, agreements were reached and the development of the report started.
In order to meet the needs of the time analysis report, the systems analyst built not only the report but also a command menu page to accommodate the functionality. An extended review of the relationships between the deliverables influenced the decision to first build the command menu page. Using SQL and visual basic for applications (VBA) coding within Microsoft Access and SQL server software, the command menu page was built.
To create the time analysis report, the systems analyst used the same coding and software tools used to produce the command menu page. Due to the report’s complexity, however, a custom module using VBA coding was developed and a conditional report formatting instituted. Lastly, links between the command menu page and the time analysis report were created.
With the time analysis report fully functional, the project team ran the report to acquire fourth quarter 2013 baseline performance figures.
Pilot

The project team met with the SSC employees to present the report and baseline numbers. A four-week pilot tested the internal theory that employees whose performance results are openly and routinely shared among members of their work group (as an application of a Lean visual office) strive harder to meet or exceed current operational standards. The feedback from employees was predictable – those employees meeting or exceeding standards had no concerns with the sharing of information while those who found themselves failing to meet the standards were not entirely enthusiastic about the idea. What ultimately sold the concept to all associates was that everyone’s performance was being shared. Additionally, improved employee efficiency would be reflected in the raw data when standard processing time ranges were recalculated. This would then generate a positive downward trend in processing times. Throughout the duration of the pilot, a time analysis report was produced weekly and distributed by email.
Results
While pilot outcomes showed a measurable improvement in productivity, the pilot revealed that employee motivation was not solely responsible for the gained efficiencies. Employees who found themselves struggling to meet the standard processing time ranges sought and received coaching from supervisory staff. The extent to which the supplemental instruction influenced the conclusion of the pilot could not be determined. An unexpected discovery was the fact that the employees lacked a knowledge of the tasks required to correctly process PO invoices. Regardless, the pilot was jointly deemed an overall success by the project team and management.
Following the pilot and its disclosures, the SSC assembled and conducted a series of employee retraining sessions aimed specifically to address trouble areas. Operational policies were updated to prevent possible processing time manipulation. New standard processing time ranges, based upon pilot data, were set in place. Employees continued to receive the time analysis report weekly and their capacity to meet PO invoice processing requirements was tied to bi-annual and annual appraisals. On the whole, the SSC creatively overcame every obstacle encountered and intends to aggressively employ this successful methodology on all future projects.