Because I live in the suburbs, driving downtown to work can be an unnerving experience on the best of days. Even when there are no accidents or stalls, there is a particular stretch of road where the six-lane highway merges into three lanes, creating long traffic jams.
Theory of constraints would suggest that there is a localized bottleneck at this point and irrespective of the six-lane highway before and the four-lane highway beyond this area, the throughput of vehicles at this point is limited by the capacity of this stretch. While the effective capacity at this location may be 100 cars per minute on the average, the average throughput (the rate at which the cars actually pass through) will be somewhat lower depending on other factors such as driving conditions, driving habits and so on.
For example, if a driver drives at a more conservative pace, the throughput will slow down further. My commute is greatly impacted by the number of cars that pass through this junction at any given time; if the inventory of these cars is greater, the wait time can exponentially grow, whereas if I am lucky and there are a smaller number of cars waiting to pass through, the wait time reduces considerably. As it is, inventory and throughput are closely linked to one another, and inventory is an important variable that greatly impacts the wait time and the time it takes me to get to the office.
Identifying Value Stream Constraints
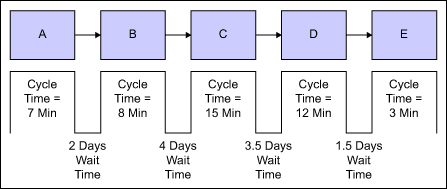
It is possible to see similar analogies in a horizontal process value chain in a company. Consider a simplified process consisting of five steps. Any step in the process can be a bottleneck that impedes faster turnaround time. A value stream map indicates the cycle time for individual steps (Figure 1).

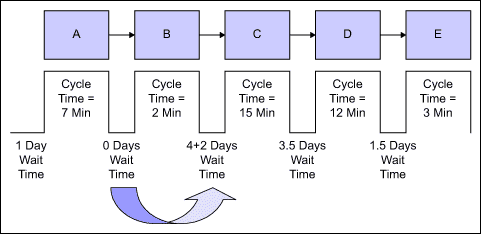
While the individual sum of the steps in this sample process is roughly 40 minutes, it is not unusual to see the cycle time for a typical application in this process to increase to days. Suppose the time to fulfill a typical application is 12 days. The challenge for an operations manager is to reduce this end-to-end time. For that purpose, it is necessary to re-examine the value stream map in Figure 1 and understand where the delays are introduced by factoring in wait times (Figure 2).

Wait times are introduced because of additional inventory waiting to be processed at each step, which results in delays. It is evident that a value stream map that ignores wait times at each step does not present a holistic picture of the total cycle time. In this case, the wait time represents a majority of the cycle time.
Options for Reducing Wait Time
What is the best way to reduce the wait time? In this case, the methods that may seem obvious are not necessarily the best choice. By analyzing the diagram in Figure 2, it is possible to draw several conclusions about options for reducing wait time:
1. Improving non-bottleneck resources – The company may decide to eliminate the wait times at each of the individual steps. For example, Step B has a wait time of two days, which results from Step B not being done fast enough. By focusing on making Step B more efficient, this wait time can be eliminated.
Suppose the practitioners at the company make step B faster. As a result, some might assume that the two days will either be eliminated or diminished. But speeding up step B only shifts the inventory from B to C because step B is not the bottleneck and step C is constrained in its ability to process inventory at a faster rate. The wait time is merely shifted.
Companies frequently focus on siloed or vertical improvement efforts, such as speeding up one step in a process, without understanding the implications on the horizontal value-added processes. This is usually a result of organizational design where management’s incentives and awards are tied with the performance of its vertical silo. In this example, if Step B represents the activities of a business unit, focusing on this silo, apart from creating a suboptimal process, has practically no impact on the end-to-end efficiency of the process (Figure 3).

2. Improving bottleneck resources – The theory of constraints suggests that all improvement efforts should be focused on the bottleneck because an hour lost on the bottleneck is an hour lost on the entire end-to-end process. Once a value stream map has been drawn, this is a routine exercise. In the above process, it is evident that the bottleneck is Step C, which has the longest individual cycle time (15 minutes). Efforts to reduce the cycle time should be focused on alleviating the bottleneck by employing various techniques, including work standardization, elimination of non-value-added activities and job balancing. As soon as the cycle time of Step C goes below 12 minutes, the bottleneck will change to Step D (cycle time of 12 minutes), as per the theory of constraints.
3. Processing in batches – While the bottleneck in this example is Step C, it is interesting to note that there is inventory waiting at each of the other steps. This may be the result of batch processing. The wait times for these non-bottleneck resources can be decreased by decreasing the batch sizes and focusing on continuous flow.
4. Triaging – A solution considered to decrease the cycle time is triaging, or dividing work among bottleneck resources by skill set or by type of work, and giving precedence to one type of application over another. This solution is only viable if it accomplishes the need to serve a more profitable client base better by serving those customers first. Another reason may be to allow the process step to take place faster because of the knowledge base built up in specialized roles.
For example, consider that in the above scenario, two types of applications are fulfilled: Type A and Type B. A decision is made to triage these two types and serve Type A applications first. This solution will not decrease overall cycle time, and is inadvisable if Type B clients are more profitable for the company because such applications will now take longer to process.
An analogy is the buildup of two queues at a grocery store with two checkout counters. One queue is an express lane for customers who have less than eight items, and the second is the regular line. The triage system ensures that people with fewer items can pass through the grocery store quicker. If the express queue is turned into a regular queue, customers from the regular queue will migrate to the express one and the wait time for a customer in this line will increase. On the other hand, the regular line now proceeds faster and the average wait time for a customer in that queue decreases. As a result there is no net gain in the average wait time. There is no change in the process because both cashiers are doing the same work. But if a helper is added who puts the items into bags, the average wait time will decrease because the process is now more efficient.
5. Limiting rework – Consider for the sake of argument that the error rate at Step C is 10 percent. When applications with errors reach the end of the process, the errors are detected and are returned to the operator in step C to correct. If the applications follow a first in, first out system and are returned to the bottom of the inventory, an unnecessary wait of four days is added for the applications with errors. Moreover, those applications add unnecessary work to the bottleneck resource. Both are undesired consequences. This demonstrates the need to limit the amount of rework, especially on the bottleneck.
Avoiding Traffic Jams
It is important to identify and understand bottlenecks before making improvement decisions. Value stream maps that factor in the average wait time, inventory and the cycle time for each step help unearth sources of wait time. Additionally, by understanding the implications of triaging, batch processing, improving of bottleneck and non-bottleneck resources, and limiting rework, more informed decisions can be made, creating a more streamlined end-to-end process.