After starting a project and gathering the voice of the customer (VOC), it is time to define the critical-to-quality outputs (CTQs).
CTQs are the key measurable characteristics of a product or process whose performance standards or specification limits must be met in order to satisfy the customer. These outputs represent the product or service characteristics defined by the customer (internal or external). They may include the upper and lower specification limits or any other factors related to the product or service. Typically, a CTQ must be interpreted from a qualitative customer statement to an actionable, quantitative business specification. Establishing CTQs is vital for a company to meet customer needs and keep up with the competition.
VOC Becomes CTQs
The flowchart in Figure 1 provides an overview of the requirements necessary to translate the VOC into usable CTQs.
Operational definitions of the flowchart steps are:
- Characteristics of product or service: A word or phrase that describes some aspect of the product or service. Example: dry cleaning process time.
- Measures and operational definitions: A definition of how the product or service’s characteristic is to be quantified. There may be several ways of quantifying a given characteristic. Example: the unit used to measure time between when the cleaner receives clothes and when the clothes are ready for pickup (hours).
- Target value(s): The aim for a product or service. If there were no variation in the product or service, this is the value that would always be achieved; it is the desired level of performance. Example: clothes ready for pickup in 24 hours.
- Specification limits: How much variation is the customer willing to tolerate in the delivery of the product or service? Specification limits are performance limits that are acceptable to the customer. Example: Upper specification limit for dry cleaning process time is 28 hours.
- Defect rate(s): This is how often the producer is willing to produce a product or service outside the specification limits. Example: 3.4 defects per million opportunities.

Data Quality and CTQs
Although it is often overlooked, data quality is an important consideration in the design effort. The impact of poor data quality can be very serious. From an organizational perspective, it may create extra costs, rework, low productivity; drive the “wrong” decisions (because of outdated data); and prompt a sense of frustration or lack of trust. From a project perspective, it could result in project delays and impairment of testing. Project teams need to assure that data associated with their designs is both accurate and complete. This may be accomplished by defining CTQs for data quality.
Possible data quality CTQs include:
- Access restriction
- Age
- Availability
- Completeness
- Definition and format
- Encryption
- Timeliness
Types of Data
Data can be discrete or continuous. When possible, practitioners should collect continuous data because it can be recorded at many different points. Examples include length, size, time, temperature and cost. Continuous data can be broken down into smaller parts, meaning practitioners can get more information about what they are measuring than from attribute data.
Setting Measurements
The design of a product or service starts with quantified requirements. Practitioners need to develop measures for which targets and limits can be established. There may be several ways to quantify a given characteristic. Practitioners should try to pick measures that can be used as inputs to design and avoid measures that are only relevant after the product or service is being produced or offered (i.e., customer satisfaction, complaints). Also, it is important to consider how the characteristic will be measured. Practitioners must avoid measurement systems that, in themselves, introduce variation into the process.
Choosing the Right Metrics
Practitioners can save a lot of frustration by choosing the right metrics up front. This will not eliminate the need to evaluate the metrics during the design process, but it will cut down on the overall project duration. The selected metrics need to be solution independent and support the product or service as an indicator of customer needs. But keep in mind that all customers are not created equal – the project may require more than one measure per customer need. Again, also choose continuous metrics if possible.
Developing Targets and Establishing Specification Limits
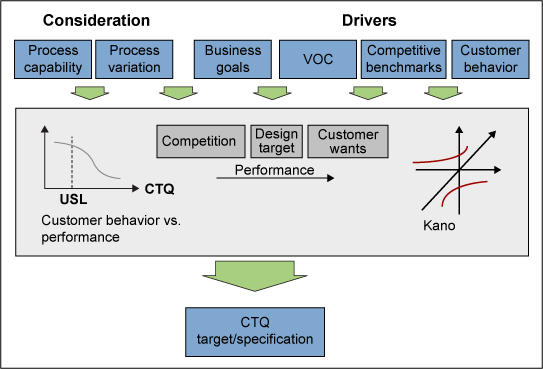
Unfortunately, there is no specific recipe for setting targets and specifications. This is a function of business know-how and technical expertise, so practitioners should use the business or subject-matter experts to assist them with brainstorming and developing these requirements. There are many variables to consider, as shown in Figure 2. (Note: Current or projected capability to achieve a performance level should not be the primary basis for establishing targets. To ensure success in the market, the customer and competitive information should be the primary drivers.)

Elements of the House of Quality
One of the most powerful tools used in defining CTQs is the quality function deployment (QFD), also known as the house of quality. This is a structured methodology and mathematical tool used to identify and quantify customers’ requirements and translate them into key critical parameters. QFD helps practitioners to prioritize actions to improve their process or product to meet customers’ expectations.
As Don Clausing and John Hauser write in their article The House of Quality about QFD: “None of this is simple. An elegant idea ultimately decays into process, and processes will be confounding as long as human beings are involved. But that is no excuse to hold back. If a technique like the house of quality can help break down functional barriers and encourage teamwork, serious efforts to implement it will be many times rewarded.”
The QFD was originally developed by Yoji Akao in 1966 when he combined his work in quality assurance and quality control points with function deployment used in value engineering. Akao described QFD as a “method to transform user demands into design quality, to deploy the functions forming quality, and to deploy methods for achieving the design quality into subsystems and component parts, and ultimately to specific elements of the manufacturing process.”
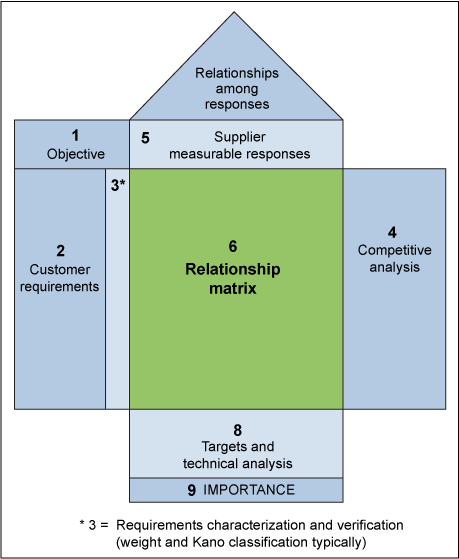
Figure 3 shows the design of the house of quality.

QFD is designed to help planners focus on characteristics of a new or existing product or service from the viewpoints of market segments, company or technology-development needs. The technique yields graphs and matrices.
Basic steps in the creation of the QFD include:
- Identify customer needs and wants (collect VOC).
- Identify the engineering characteristics of products or services that meet VOC.
- Set development targets and test methods for the products or services.
Once again, the QFD helps transform VOC into engineering characteristics (and appropriate test methods) for a product or service, prioritizing each product or service characteristic while simultaneously setting development targets for the product or service, all of which are necessary in defining CTQs.
One of the biggest advantages of QFD is that the process requires groups of cross-functional representatives to work together to understand customer expectations in a way that focuses on customer requirements by using and strengthening functional teamwork. It provides flexible and easy-to-assimilate documentation and uses competitive positioning and marketing potential to prioritize design goals. Finally, it translates soft customer requirements into measurable goals.
Benefits experienced when using the QFD include a reduction in design, a reduction in design changes and a reduction in start-up costs.
Lessons Learned When Using a QFD
QFD is more of an art than a science. The big benefit comes from the discussion the process generates. Practitioners might be surprised to find that even with the simplest process, a QFD requires a lot of effort. Many entries may look obvious, even after they are written down; however, if there are no “tough spots,” it probably is not being done right. Practitioners must always focus on the end customer and remember that “charts” are not the objective. Most importantly, QFD is a valuable decision support tool; it is not a decision maker.
QFD is an organizing tool – the bulk of the effort lies in gathering the inputs to the house of quality. The QFD should be performed via a cross-functional team and communicated to all involved in the design. Although QFD takes time, it will ultimately save time spent reworking “defective” designs and assist in balancing time commitment with benefits.
Mitigating Potential Impacts
How does the inability to meet major CTQs in the design – or of not considering a CTQ – impact the customer or a company? Potential customer impacts include an increase in product or service variability, non-functional products or services, delays in delivery time and cost of the product or service, as well as a decrease in value to the customer.
Potential internal impacts include increased rework and costs, and loss of profit margin, customers (or return customers), and growth opportunities for not keeping up with its competition, which can lead to barriers to entry in other markets. Therefore, defining CTQ requirements should be at the top of a project’s priorities.