
Many Six Sigma companies experience challenges in their effort to calculate and allocate benefits from throughput projects. This is a complex process, especially when the throughput capacity profile includes several different processes that behave independently, and where bottlenecks shift from one process to another. Employing the theory of constraints provides an effective solution.
At BHP Billiton Base Metals, many ways of addressing this problem were tried until it was decided to apply the theory of constraints. The most difficult part of the application was convincing the operations area that it was the appropriate approach. It also was difficult to get process owners to understand that, although their project could significantly increase the capacity of a process, it might not have an impact on the bottom line because it does not address a bottleneck in the system as a whole.
By using the theory of constraints, the company was able to develop a system where credit for project benefits is shared across all businesses that directly or indirectly contribute to increasing the total throughput of the system.
Understanding the Bottleneck
In any process there is always at least one constraint or bottleneck. As modifications are made to the process, the bottleneck often changes. It may be a piece of equipment, a process or any one of the following:
- A policy
- A procedure
- The market (supply or demand)
- A system
- Operating procedures
That clearly identifiable constraint in a process prevents the generation of maximum output. When the throughput capacity of a bottleneck increases, there are three possible outcomes:
- The bottleneck is reduced but remains after the improvement, creating additional throughput project opportunities.
- The new capacity of the bottleneck equals that of another part of the process. This may prevent the project from generating all theoretical benefits possible because there are now two bottlenecks adversely impacting each other.
- The original bottleneck capacity now exceeds the capacity of other parts of the process. These parts become new constraints preventing realization of the entire projected value associated with the original project.
Examples of Applying the Theory
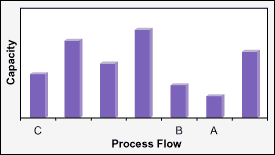
To ensure that a throughput project has predictable results, plot the capacity of the various stages of the process on the vertical axis of a diagram that has the process flow along the horizontal axis (Figure 1).
This is the capacity profile. To ensure effectiveness, use consistent units of measure. For example, in the early part of a mining process, tons of ore (at any grade) is the capacity, whereas downstream during the beneficiation process, the impact of grade must be considered by fixing grade as a stated constant. In the mining business, the profile starts with development drilling and analysis all the way through to shipping a final product.
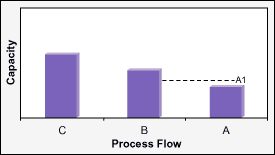
If the capacity of Process A is increased to level A1 (Figure 2), the project is expected to return the anticipated benefits.
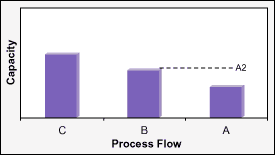
Process A’s capacity now equals that of Process B (Figure 3). If there is no significant buffer between the two (i.e., they are very close to being direct – coupled), there is a chance that achievement of all theoretical benefits associated with a change to level A2 (equal to B) is in jeopardy.
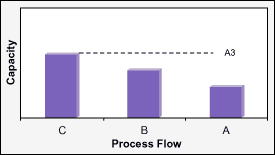
The capacity of Process A now equals that of Process C (Figure 4). If the capacity of Process B does not increase, the maximum benefit will equal the capacity of Process B. In that situation, all theoretical benefits associated with a change to the level of Process A3 (equal to C) will not be achieved. In this case, all of the benefit is allocated to the team working on Process A. However, if the team working on Process B increases its capacity to a point between B and C, that benefit will be shared with Team A, which has increased its capacity to that of level C.
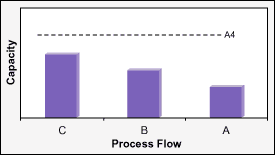
If Process A’s capacity were increased to A4 (Figure 5), this complete increase in benefits could only be achieved if B and C also were increased in capacity with other projects. If Process B’s capacity were increased above C’s capacity with another project, so that C becomes the constraint, then the value of the two projects is assessed as in the table below.
| Project | Increase | Credit for the Benefits |
|
A |
From A to B |
Team from Project A |
|
B |
From B to C |
Team A and B share value for this project, equally |
|
C |
From C to A4 |
All three teams, A, B and C, share this increment |
As represented in the examples above, it is critical to the success of this methodology to know where the bottleneck is in the process and also the capacity of the different processes within the entire system. If the location of the bottleneck is not known, it is beneficial to identify it first before applying Six Sigma to improve the process.
In most Six Sigma organizations, Six Sigma resources are limited. Allocation of these resources to projects that have an impact on reducing bottlenecks in the process is an effective way to reduce waste and rework within the process.
Counting Benefits and Sharing Credit
The benefit of all these projects together is found in the additional production that results. For bottom line impact, these revenue benefits are as important as cost savings. Using this approach, the company also ensures the elimination of duplicate counting of benefits when different project teams are working at the same time in different areas of the throughput line.
Sharing credit for the benefits of projects that have directly or indirectly contributed to increasing the total throughput of the system generates a positive impact on the behavior of the teams involved. Teams understand that, even if their project may not have an immediate impact on improving the whole system, when the final bottleneck is addressed, their project will be acknowledged for its role in the higher throughput level. This also is beneficial in motivating project teams to use Six Sigma as an effective tool for improving processes.