Manufacturing facilities often are faced with major challenges when it comes to large-scale process improvement. Improving yields at a large manufacturing plant – one that produces millions of pounds of product annually – might require modifications for every step in its process: production equipment, maintenance strategies, operational procedures, process control strategies and analytical support strategies, as well as its business strategy that decides what product is run, where and when. Each stage in the process can contribute potential root causes that might impact plant performance negatively.
To help keep track of these potential root causes and improvements, Belts may benefit from a methodology called the opportunity matrix. Over the years, I have applied this matrix to identify and systematically attack the root causes that process experts feel are likely to have the greatest impact on an organization’s performance.
In the cases where the opportunity matrix has been applied, it has saved (and continues to save) millions of dollars for manufacturers. However, the beauty of the matrix is that it has universal applications for improving processes – in the manufacturing field and beyond.
Brainstorming the Root Causes
Every process improvement project is charged with achieving an objective, and that starts with effective brainstorming.
First, team members – experts from operations, support, maintenance, supervision, technical sales and possibly even business planning – brainstorm collectively to identify a list of potential problem root causes (25 to 150). Going around the room, each suggests a root cause in turn, frequently building on the suggestions of others, in a process that typically lasts a few hours. During this session, the emphasis is always on generating as many root causes as possible, holding any conversation to short statements of clarification. No judgment is allowed.
The team also identifies other potential contributors – perhaps those working directly with the process now or in the past, such as engineers and maintenance or operational personnel. These people should be interviewed by selected team members after the initial brainstorming session to gather additional root causes that are then added to the team’s list. The team leader then collates the root causes and requests that each team member, as well as the other experts, elaborate on any root cause that they had suggested (usually one or two written paragraphs suffice).
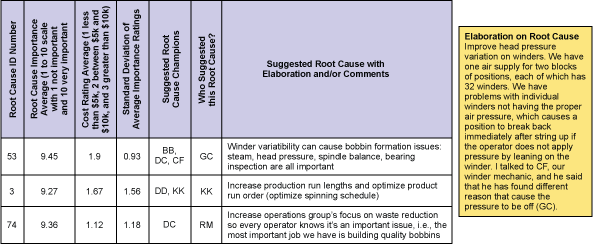
Using this information, the team leader builds an Excel spreadsheet (see Figure 1). In this page, each root cause is given an ID number. Column G holds a root cause in each row, with its elaboration as that cell’s comment. The team member who made the comment is identified with initials in Column F.

This file is then sent to each team member, as well as to the other experts, who are asked independently to rank the order of importance for each root cause on a scale of 1 to 10 (with 1 being “not important at all” to 10 being “extremely important”). The members also should be asked to do the same for the estimated cost of each root cause on a 1 to 3 scale. (In this scenario, 1 represents “less than $5,000, 2 is “between $5,000 and $10,000,” and 3 is “greater than $10,000.”)
Each team member is also asked to suggest a Champion who he or she thinks should lead the team’s effort in attacking each particular root cause. The importance ratings are placed in Column B, the cost ratings in Column C and the suggested Champion in Column E (shown in Figure 1 as initials). These are then sent back to the team leader for collation.
For each root cause, the team leader calculates the average ratings for importance (Column B) and cost (Column C), the standard deviation of the importance ratings (Column D), the potential Champion candidates (Column E), the person suggesting the root cause (Column F), the root cause and its elaboration (Column G).
The summary shown in Figure 1 was collected from a team that was charged with improving the yield of a yarn spinning method, called the “no-shock” process. No-shock yarn is an antistatic fiber that is often inserted into carpet yarns to eliminate static electricity.
Creating the Opportunity Matrix
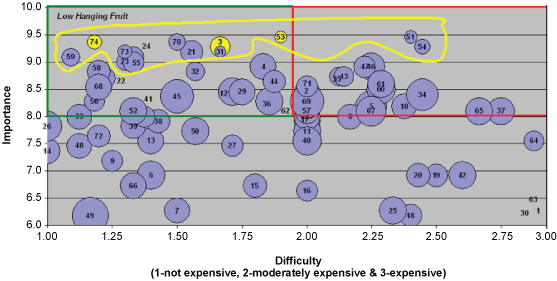
From the root cause brainstorming data, the Opportunity Matrix can then be constructed as a plot of the importance ratings against the cost ratings.
In the case of the no-shock yarn scenario, the team came up with 75 suggested root causes, which are depicted in Figure 2. Each root cause bubble is labeled by its given ID number.

The size of each bubble was set as the size of the importance ranking’s standard deviation, so the smaller the bubble the greater the consensus among the 10 team members who provided feedback. The area above 8.0 in average importance and below 2.0 in cost ratings is judged to be “low-hanging fruit,” contained within the green box.
The 13 bubbles at the top, encircled in yellow, were those chosen by the team to be championed. Later, as some of these 13 root causes were put to rest, others were picked up. Remember the 80:20 rule as it applies here: In any group of potential root causes, 20 percent typically prove important (the problem is that one doesn’t really know which of the root causes contribute to the 20 percent).
Improvements Achieved
Team members, each championing one to three of the highest-ranked root causes, led the team’s effort in investigating all 13 root causes. Progress for each root cause was reported at the team’s meetings, held regularly every two weeks.
The following information was used in a series of slides by one team member to outline the plan of attack and to track its progress:
Improve Head Pressure Variation on Winders
Problem: Winder head pressure variation can produce imperfect yarn packages, hence increase the level of fiber waste
Improvement Path
- Routinely check seals in contact cylinder
- Run a third air line in the shop to check pressure switches
- Check the parallelism after the CPA timer engages
- Check clearances between the drive roll and spindle
Opportunity Status
- Need engineering help to develop a field-checking device
- Hooked up air gauge in shop to check head pressures on the A production line
- Implemented a routine check of winder parallelism to improve the distribution of applied pressure
- Retubed F & G blocks under the winders to eliminate any chance of pressure drop
- Routinely checking all head cylinder seals to be assured that there are no leaks in air pressure
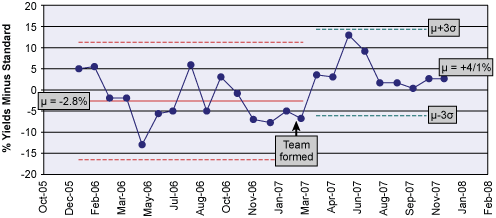
The team member would add to or edit his slides for each biweekly meeting. After just a few months, the no-shock team implemented its improvements. As shown in Figure 3, process yields increased from -2.8 percent below standard to +4.1 percent above, saving the company about $1 million dollars.
In the second half of 2008, a second multifunctional team with an expanded set of skills, identified 78 more root causes associated with cost, then implemented changes to produce an estimated $879,000 in savings for the no-shock process.

Once a Six Sigma team is formed and supported seriously by upper management, results tend to follow quickly as people become more focused and are made more accountable. Those closest to the process – the experts mentioned above – used the opportunity matrix to identify the root causes that are potentially important to the problem. After that, it was simply a question of reviewing history, gathering data, conducting experiments, assessing results and implementing changes.