
Short production runs are a necessity in high-mix, low-volume manufacturing environments. The trend in manufacturing has been toward smaller production runs, with production runs – as well as products – tailored to the individual customer’s needs. Although this minimizes inventory and improves responsiveness to the customer, it complicates the application of statistical process control (SPC).
Classical statistical process control (SPC) methods, such as individual and moving range, X-bar and R charts, were developed in the era of mass production of identical parts. Production runs lasted for weeks, months and even years. Many SPC rules of thumb were created for this environment (as noted in The Six Sigma Handbook by Thomas Pyzdek). This may not have been a problem in low-mix, high-volume production, but it is impractical or impossible in today’s high-mix, low-volume production. In a low-volume, high-mix situation the entire production run can be fewer parts than are required to start a standard control chart. Standard SPC methods can be modified slightly to work with small runs.
Analyzing Variable Data
As a rule of thumb, if at least 10 different values occur and repeat values make up no more than 20 percent of the data set, data can be considered variable. Otherwise the data is considered to be discrete and attribute control charts should be used.1 There are several approaches for short runs using variable data, but the Z-MR chart is preferred because all the subgroups are used; other methods exclude subgroups. The following explains what the Z-MR chart is and how practitioners can use it.
Using a Z-chart
Statisticians and engineers often use normalizing transformations. Sigma level and process capability are two common applications of normalizing transforms. Sigma level is the same thing as Z-value – this normalization is simply the number of standard deviations from a value of interest and the mean of the data. The Z-value can be used to create control charts that are independent of the units of measure. Several different characteristics can be plotted on the same control chart as long as they are produced in a similar process. Z-charts are independent of the units of measure and can be thought of as true process control charts. A Z-MR chart can be used with short-run processes when there is not enough data in each run to calculate proper control limits. Z-MR charts standardize the measurement data by subtracting the mean to center the data, then dividing by the standard deviation.
![]()
Standardizing allows a practitioner to evaluate data from different runs by interpreting a single control chart. The Z-chart option is supported by Minitab (and other statistical software products). The standardized data comes from a population with the mean = 0 and the standard deviation = 1. With that, a single plot can be used for the standardized data from different parts or products. The resulting control chart has a center line at 0, an upper limit at +3 and a lower limit at -3.
Example of a Z-chart
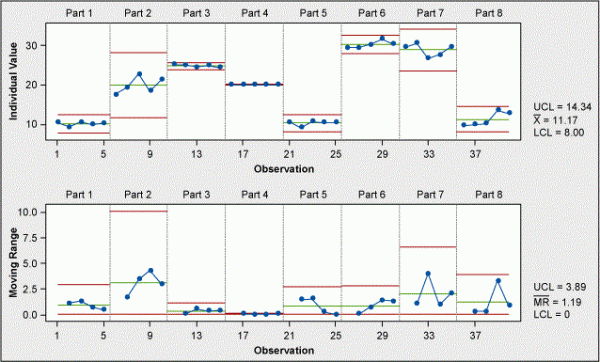
A specialty manufacturer of pick-and-place heads for small parts has a new process for making a vacuum orifice. This process is being used on eight parts with different-sized orifices ranging from 10 microns to 30 microns in diameter. These parts are hard to measure and are run in small batches. There are, thus, few samples to study but whether the process is stable and controlled needs to be understood. (Note that the measurement system has been validated.)
The two parts of Table 1 show the first set of data.
| Table 1: Sample Data Set (Part 1) | |
| Part Numbers | Measurement |
| 1 | 10.34 |
| 1 | 9.23 |
| 1 | 10.54 |
| 1 | 9.84 |
| 1 | 10.30 |
| 2 | 17.56 |
| 2 | 19.26 |
| 2 | 22.72 |
| 2 | 18.45 |
| 2 | 21.42 |
| 3 | 25.08 |
| 3 | 25.02 |
| 3 | 24.46 |
| 3 | 24.80 |
| 3 | 24.39 |
| 4 | 20.01 |
| 4 | 19.93 |
| 4 | 19.96 |
| 4 | 19.97 |
| 4 | 19.89 |
| 5 | 10.58 |
| 5 | 9.12 |
| 5 | 10.67 |
| 5 | 10.38 |
| 5 | 10.39 |
| 6 | 29.37 |
| 6 | 29.43 |
| 6 | 30.16 |
| 6 | 31.56 |
| 6 | 30.23 |
| 7 | 29.52 |
| 7 | 30.56 |
| 7 | 26.59 |
| 7 | 27.57 |
| 7 | 29.66 |
| “>8 | 9.57 |
| 8 | 9.90 |
| 8 | 10.20 |
| 8 | 13.50 |
| 8 | 12.67 |
| Table 1: Sample Data Set (Part 2) | |||
| Part Number | Mean | Standard Deviation | Range |
| 1 | 10.049 | 0.523 | 1.303 |
| 2 | 19.88 | 2.136 | 5.16 |
| 3 | 27.749 | 0.315 | 0.686 |
| 4 | 19.953 | 0.0438 | 0.116 |
| 5 | 10.229 | 0.632 | 1.552 |
| 6 | 30.149 | 0.883 | 2.185 |
| 7 | 28.782 | 1.639 | 3.969 |
| 8 | 11.168 | 1.788 | 3.932 |
If this data is put in an individual and moving range (I-MR) chart, the result has little meaning as there is not enough data to calculate statistically correct control limits. A Z-chart (Figure 1) can overcome this limitation.
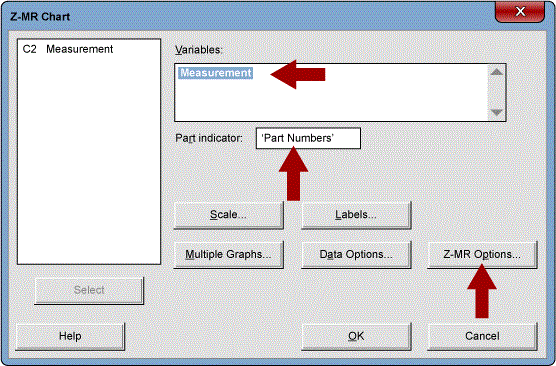
To build the Z-chart using Minitab: choose Stat > Control Charts > Variables Charts for Individuals > Z-MR Chart. In Variables, select Measurement and Part Numbers for part indicator.
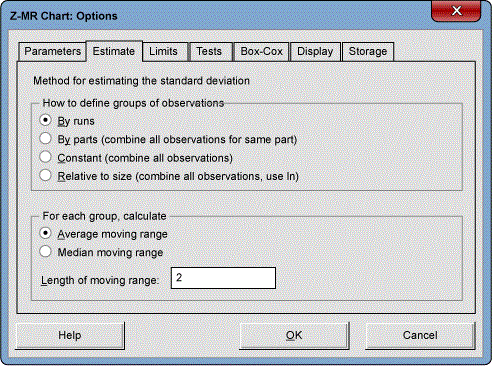
Minitab provides four methods for estimating ![]() , process standard deviations. Choose an estimation method based on the properties of the particular process or product at hand. Or enter a historical value. The data plotted in the Z-chart is Zi where
, process standard deviations. Choose an estimation method based on the properties of the particular process or product at hand. Or enter a historical value. The data plotted in the Z-chart is Zi where ![]() . Make assumptions about the process variation, but note that this should not be taken lightly as results will differ between assumptions. Based on the assumptions made, the estimate of standard deviation changes.
. Make assumptions about the process variation, but note that this should not be taken lightly as results will differ between assumptions. Based on the assumptions made, the estimate of standard deviation changes.
Use Table 2 to help select a method of estimation.
| Table 2: How to Select a Method of Estimation | ||
| Method Type | Use When | Does This |
| Constant (pool all data) | All the output from the process has the same variance – regardless of the size of the measurement | Pools all the data across runs and parts to obtain a common estimate of s |
| Relative to size (pool all data, use log [data]) | The variance increases in a fairly constant manner as the size of the measurement increases |
|
| By parts (pool all runs of same part/batch) | All runs of a particular part or product have the same variance | Combines all runs of the same part or product to estimate s |
| By runs (no pooling) * default option | It cannot be assumed that all runs of a particular part or product have the same variance | Estimates s for each run independently |
Under Z-MR Options, select estimates and pick “by Runs” (default) as equal variance cannot be assumed, as shown in Figure 3.
Click OK and OK again. The resulting control chart is shown in Figure 4.
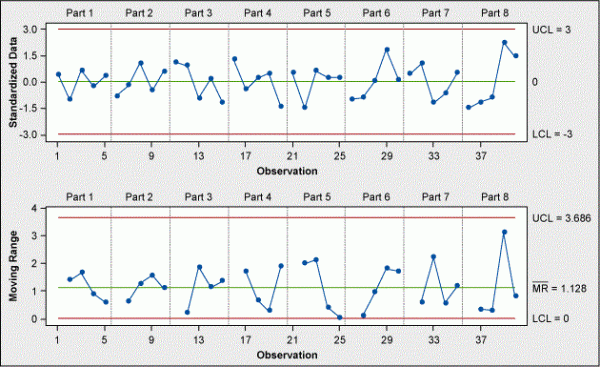
The process is stable and in control.
Stabilized (Z) Attribute Control Charts
There are two issues with plotting attribute data from short-run processes.
- Different subgroup sizes that result in messy charts with different control limits for each subgroup. Even patterns are difficult to detect. As the sample size changes, the central tendency changes along with the control limits.
- There are a small number of subgroups per production run. This makes it difficult to track process trends because the trends are broken up across many different control charts for the same part number. Technically, there are not enough subgroups to calculate statistically valid control limits.
Because of these difficulties, many people believe that SPC is practical only for long, high-volume runs. This is not necessarily true. In many cases, stabilized attribute charts can eliminate both of these problems. The downsides to stabilized charts are that they are more complicated to develop and there are not standard options in most common statistical software. These charts must be made manually or a macro must be created. They may require more effort but they can be useful.
Stabilized attribute charts may be used if a process is producing parts or features that are similar. Stabilized (Z) attribute control charts also solve the issue of varying control limits and central lines due to varying sample sizes, making the chart easy to visibly interpret.
Here is a typical scenario: A job-shop welding operation produces small quantities of custom items. The operation, however, always involves joining parts of similar material and similar size. The process control statistic is weld imperfections per 100 inches of weld.
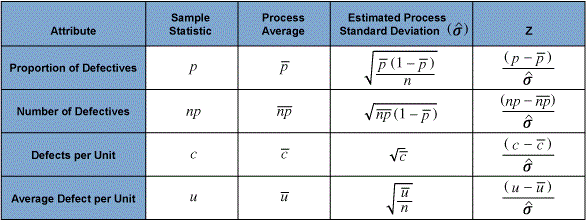
Methods used to create stabilized (Z) attribute control charts are all based on their corresponding classical long-run attribute control chart methods. There are four basic types of control charts involved:
- Stabilized p charts for proportion of defective units per sample
- Stabilized np charts for the number of defective units per sample
- Stabilized c charts for the number of defects per unit
- Stabilized u charts for the average number of defects per unit
All of these charts are based on the following transformation:
![]()
Stabilized (Z) attribute charts can be used for long-run u and p charts with varying sample sizes. This can be used to eliminate the varying and confusing control limits.
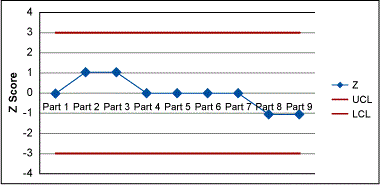
For example, 10 part numbers run in different small runs. The parts are similar but different. The number of defective units has been recorded and it is desired to determine if the process is in control. Table 4 displays the application of the formulae above. The calculated Z scores can then be plotted and compared to ±3 standard deviations. As all our values fall within ±3, our process is in statistical control for defective units.
| Table 4: Results of Small Run Results | |||||||||
| Part Number | Sample Size | Defectives (np) | p | Z | UCL | LCL | |||
| 1 | 10 | 1 | 0.1 | 1 | 0.942809 | 0.942809 | 0 | 3 | -3 |
| 2 | 15 | 2 | 0.133333 | 1.06066 | 3 | -3 | |||
| 3 | 20 | 2 | 0.1 | 1.06066 | 3 | -3 | |||
| 4 | 15 | 1 | 0.066667 | 0 | 3 | -3 | |||
| 5 | 8 | 1 | 0.125 | 0 | 3 | -3 | |||
| 6 | 10 | 1 | 0.1 | 0 | 3 | -3 | |||
| 7 | 12 | 1 | 0.083333 | 0 | 3 | -3 | |||
| 8 | 15 | 0 | 0 | -1.06066 | 3 | -3 | |||
| 9 | 10 | 0 | 0 | -1.06066 | 3 | -3 | |||
Conclusion
SPC can be used for short production runs and may be helpful in any operation. At a minimum, these charts are more tools to include in the continuous improvement toolbox.