Several management approaches, including Six Sigma, involve a key focus on process analysis. Too often processes are schematically represented in boxes and arrows. While this final result of a process analysis is beneficial, practitioners should ensure they are considering the numerous factors and components that influence a process and how it is viewed.
Stakeholders and Points of View
Consider a well-defined activity, such as a manufacturing process. For the same manufacturing process, the inputs, outputs, risks and metrics may differ for various stakeholders (Table 1).
| Table 1: Examples of Different Factors for Different Stakeholders | |
| Stakeholder | Key Factors |
| Shareholders | Costs and benefits |
| Customers | Product information and contract requirements |
| Neighbors | Air emissions |
| Workers | Safety |
The workers, equipment and instructions used to complete an operation are viewed as tools, resources and costs for customers and shareholders, for example, but the reference system changes when viewed from the workers’ eyes. For instance, maintenance tasks completed to support production capability also can be seen as part of worker safety improvement. The same process activity provides different benefits for different stakeholders.
Tangibles and Intangibles
Another component of process analysis is the results produced by the process. Consider, for instance, the criteria of tangible or intangible results and assume the customer point of view. A product could be described by several characteristics that can be concrete and perceived by a customer (the taste of a flavor), and measured and recorded on different media (for instance, the report of a control plan). A result of a manufacturing process is a “product,” but the output described on a process map is, for instance, the record of a particular metric. This is not the “true” product, but the point of view of quality for this product.
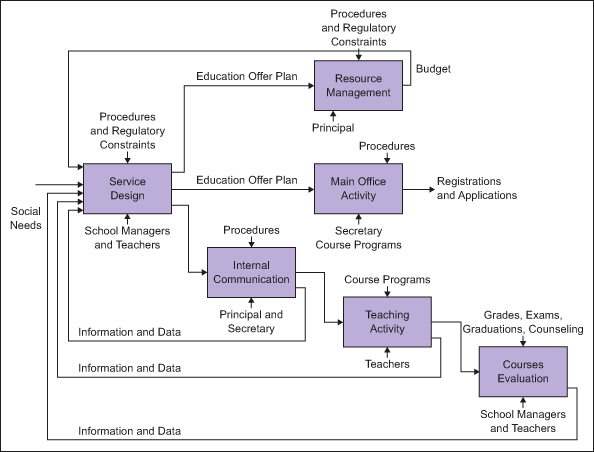
Some outputs can be easily described through measurable and evident characteristics (e.g., a mechanical part), others require a deep evaluation of customer relationships. This customer relationship aspect is mainly stressed in service organizations. In these service cases, the results of processes are mainly outcomes rather than outputs, underlining the importance of interactions between the organization and the customer. Figure 1 shows the processes and outcomes for sample education and training activities.

The result of a student’s education is codified by judgment and translated into grades on report cards; these reports represent the visible output of education activities. However, many aspects of a student’s performance, such as behavior, relationships and motivations, cannot be easily translated in summarized descriptions and require a different notation. School outputs are deeply influenced by student-teacher and student-student interactions. Hence, students are co-makers of learning processes. In this case, the quality of service depends on the motivation and involvement of the customers and suppliers.
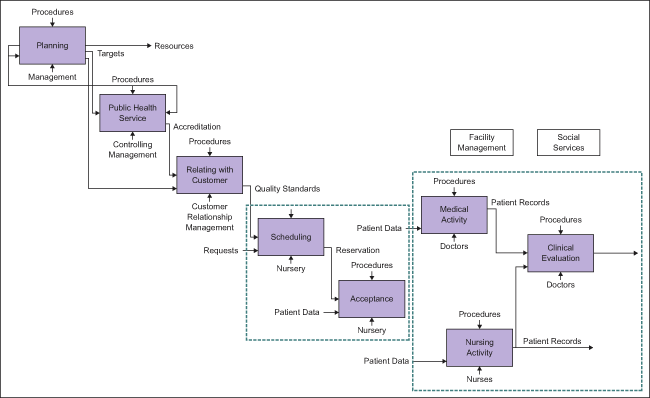
Similarly, consider clinical processes and their results. The result of a diagnosis and therapy process is usually synthesized in clinical records as evidence of disease and its evolution. This status could be influenced by patient-physician or patient-nurse relationships, as well as by the whole set of hospital services (e.g., reception, cafeteria, cleaning). Often these services are more important in patient perception than the clinical ones.
Capturing all these concurrent and multi-level hospital service activities in a process analysis is a challenge, and the points of view of the hospital and patient can be very different. The summary of all tangible and intangible inputs and outputs requires a wide-ranging process map (Figure 2).

Detail Levels and Metrics
Detail level is the most complex component of process analysis. First, practitioners must define system boundaries, and what is inside and outside the process scope. Once the “building” has been defined, the number of “floors” is influenced by many variables: organization characteristics, key events and risks.
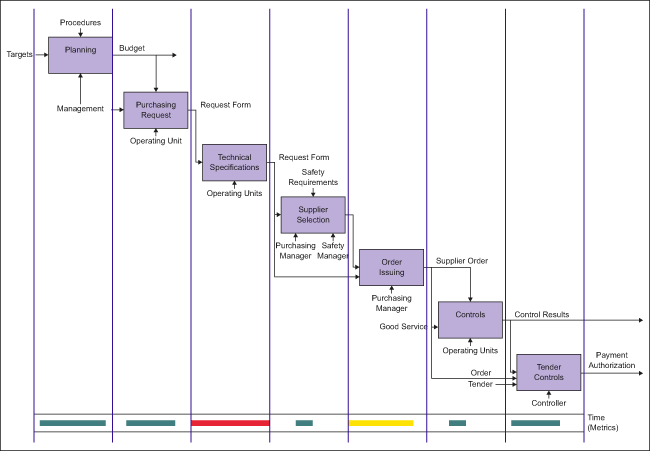
As for the description of physical process activities, a time axis can be added to the space axis. The time is a measure across process activities, for instance through the phases of a buying process or as cycle time in a customer order management process (Figure 3). Time is also a key reference in management improvement. Analysis describes a process “as is” with the aim to figure out the process that “will be” in the future, in relation to improvement targets.

Capturing the Process
A process analysis also requires competence, experience and sensitivity from the people involved in identifying and describing the steps of the process. People often describe the same activities differently. In particular, a good description requires the person doing the analysis to involve the process owners. To have useful results, it is important to calibrate and smooth out subjective interpretations; several interpretations and interests can often be present in the same area. A working group can help the analyst in averaging the different evaluations and reducing the bias.
Process Map Necessities
A quality process map requires good notation tools. These tools must:
- Be able to clearly identify multiple inputs and outputs, and process interactions.
- Be able to represent serial processes (e.g., manufacturing process phases) and parallel processes (e.g., a concurrent engineering process) and to describe the chain backward and forward.
- Be able to easily describe several detail levels and to link them with proper process owners.
The subjective bias also can be reduced by supporting evaluations with information related to process metrics and results. For instance, the different perceptions, between production and service areas, of the time for maintenance intervention can be solved by registering and measuring timing data.
Even the point of view of the practitioner completing the analysis influences the building of the management model. If the analysis is driven by the goals of a management system, interviews with process owners may be conditioned by those requirements. It is important to avoid predetermined targets becoming the only focus of analysis.
Return on Analysis Investment
Mapping process can be a complex task; however, the investment should give returns that are related to tangible and intangible results. Some advantages of process analysis and mapping:
- Improves detection of management bottleneck
- Allows for a better definition of metrics and correlation with management models (i.e., responsibilities, operating procedures, information flows)
- Provides a useful backbone for risk analysis and management
- Aids in human resource management to improve concurrent behaviors and to prevent undesired ones, and to facilitate employee communication, motivation and involvement.