Category: Methodology

Black Belt vs. Master Black Belt in Six Sigma: What’s the Difference?
Published:What is a Black Belt (BB)? A Six Sigma Black Belt (BB) is a trained and certified professional who has achieved a high level of expertise and experience in the Six Sigma methodology. Six Sigma is a data-driven methodology and management philosophy that aims to improve the quality of processes, reduce defects, and minimize variability […]
Read more »
Six Sigma vs. Agile: What Are the Differences?
Updated:What is Six Sigma? Six Sigma is a disciplined, data-driven approach and methodology used by organizations to improve their processes and reduce defects or errors. It was originally developed by Motorola in the 1980s and has since been adopted by numerous companies across various industries. The term “Six Sigma” refers to a statistical concept that […]
Read more »
Six Sigma vs. Lean: What’s the Difference?
Updated:What is Six Sigma? Six Sigma is a quality control methodology that is utilized to improve processes through the elimination of defects. In practice, the methodology incorporates project management, analysis, and statistics to improve the functionality of a business by addressing defects in a process. The cornerstone of the Six Sigma method is the DMAIC […]
Read more »
How DMAIC Helped San Antonio Increase the On-Time Payment of Street Maintenance Contractors by Nearly 20%
Published:We all need payment for the work that we do. It is really that simple. If contracted out to do a job by somebody, you need to be able to count on compensation for the work done on that job within a reasonable amount of time. Contractors that worked on street maintenance projects for the […]
Read more »
How the Six Sigma Quality Improvement Process Practically Eliminated False Fire Alarms at US West
Published:In the early 1990s, US West was an organization that was leading the charge in telecommunications. At the time, their buildings were being plagued by disruptive false fire alarms. How it was dealt with is a great example of how to apply the Six Sigma quality improvement process, a method applicable to nearly any quality […]
Read more »
How Starting With a Six Sigma Scorecard Led to Significant Increases in On-Time Deliveries, Efficiency, and Profit Within a Year
Updated:When many think of Six Sigma, they first think of massive corporations utilizing the methodology for quality and process improvement. They do not generally associate it with the mom-and-pop shop down the street. The truth is that plenty of smaller companies use the Six Sigma method to optimize their businesses. The only reason that most […]
Read more »
Littelfuse’s Journey to Operational Excellence: How Six Sigma Processes Improved Quality and Reduced Costs
Updated:Littelfuse is a manufacturing company that produces electronic products for various industries. The company was facing a problem with its production process, as it was experiencing a high defect rate that was causing delays and increasing costs. Products were experiencing defects and failures, which resulted in customer complaints, rework, and repairs. These quality issues were […]
Read more »
DMAIC Helps Miami-Dade Public Library Improve Services and Save Money
Updated:In 2018, the Miami-Dade Public Library System utilized Six Sigma methodology to improve upon the time needed for the transporting of library materials. The utilization of Six Sigma to meet the needs of this type of organization is an exciting example of just how versatile these tools can be. When we go to the library, […]
Read more »
How Six Sigma and the DMAIC Process Made Samsung Into an Industry Leader
Updated:With strategic implementation, Six Sigma can do wonders for an organization. The methodology can drastically improve processes, cut down on waste, and even help provide better results in the design and R&D of new products. Samsung found that it was having issues with all of the above and, in 1999, conducted a complete overhaul of […]
Read more »
Maximizing Results with Orthogonal Regression
Updated:Have you ever wondered whether the outgoing inspection values from your vendor are equivalent to the values of your incoming inspection? Maybe it’s time to use orthogonal regression to see if one of you can stop inspecting. If your vendor is doing final outgoing inspection, do you need to also do incoming inspection on the […]
Read more »
How Utilizing the Full Six Sigma Process Helped Turn Wipro Into a Global IT Leader
Updated:In the 1980s, Wipro made the leap from being primarily known as a vegetable oil company in India into the world of IT. In order to be a competitor in this industry on a global scale, Wipro would need to continually improve its performance as well as work smarter towards meeting the needs of its […]
Read more »
Randomization: Key to Reducing Bias and Increasing Accuracy
Updated:Not all experiments are created equal. Learn how randomization can improve the validity of any business’ experiments aligned with Six Sigma principles. Randomization in Six Sigma Business owners and managers want to know what works and what doesn’t when it comes to existing processes and methods of operation. Running experiments and assigning inputs and outputs […]
Read more »
How to Track and Improve Customer Expectations Using Result Measurables
Updated:Measurables indicate how a process is performing or how customer expectations are being met. These indicators are quantifiable, expressed numerically, and can have units of measurement. There are two kinds of these indicators. They are process measurables and result measurables. It is important in any business to know if you are meeting the expectations of […]
Read more »
Y
Updated:In discussions about the Six Sigma methodology, you will often find the equation Y=F(x). It is an important formula in working with the methodology and can serve as a very helpful tool in project management. When working with the Y=f(x) formula, X stands for the various inputs utilized to generate an outcome, while f represents […]
Read more »
How Simple Linear Regression Helps Make Sense of Data
Updated:What is the point of having a bunch of raw data if you don’t have the tools to analyze it? Regression models provide you with the ability to see if there is a relationship between two types of variables, helping make some sense of data that has been collected by fitting it to a line. […]
Read more »
How a Drone Project Increased Efficiency and Eliminated Waste
Updated:Arrow Electronics had already been utilizing Six Sigma practices when it introduced its drone project in 2016 at its two main distribution centers in Malaysia and Asia. The drone project gained them further recognition for their use of Six Sigma methodology and helped usher in a new era of using drones in warehouses in the […]
Read more »
Determining Total Cost of Quality Can Improve Your Business Processes
Updated:You are probably familiar with the notion that there are costs of poor quality, often shown as COPQ. These represent both internal and external failures to maintain good quality. There are also costs associated with maintaining good quality sometimes represented as COGQ. These costs represent appraisal and prevention costs. Total Cost of Quality (TCOQ) is […]
Read more »
What are Transformations? A Complete Guide
Updated:Many statistical tools assume normality. Is there an option if my data is not normal? Transforming your data might help. Some statistical methods, such as hypothesis testing, have an underlying assumption of the normality of your data before they can be used. Although control charts are generally robust to normality issues, sometimes the data is […]
Read more »
Sampling
Updated:It is often not possible or practical to collect all the data from your process. It can be too costly or take too much time. It may not be possible to access all the data. If this situation exists in your process, then you will need to sample your data. Overview: What is sampling? There […]
Read more »
What You Need to Know About ISO 9000 Series of Standards
Updated:ISO 9000 is a series of standards, developed and published by the International Organization for Standardization (ISO). It defines, establishes, and maintains an effective quality management system for manufacturing and service industries. Overview: What is the ISO 9000 series? ISO 9000 is a series of individual standards. The core standards contained within the series are: […]
Read more »
Make Informed Decisions with Quantitative Data
Updated:There are two broad categories of data in statistics: quantitative data and categorical data. Quantitative data is something you measure or count while categorical data presents data in categories or groups rather than the actual values themselves. Overview: What is quantitative data? Quantitative data describe values and numbers which are measured or counted and can […]
Read more »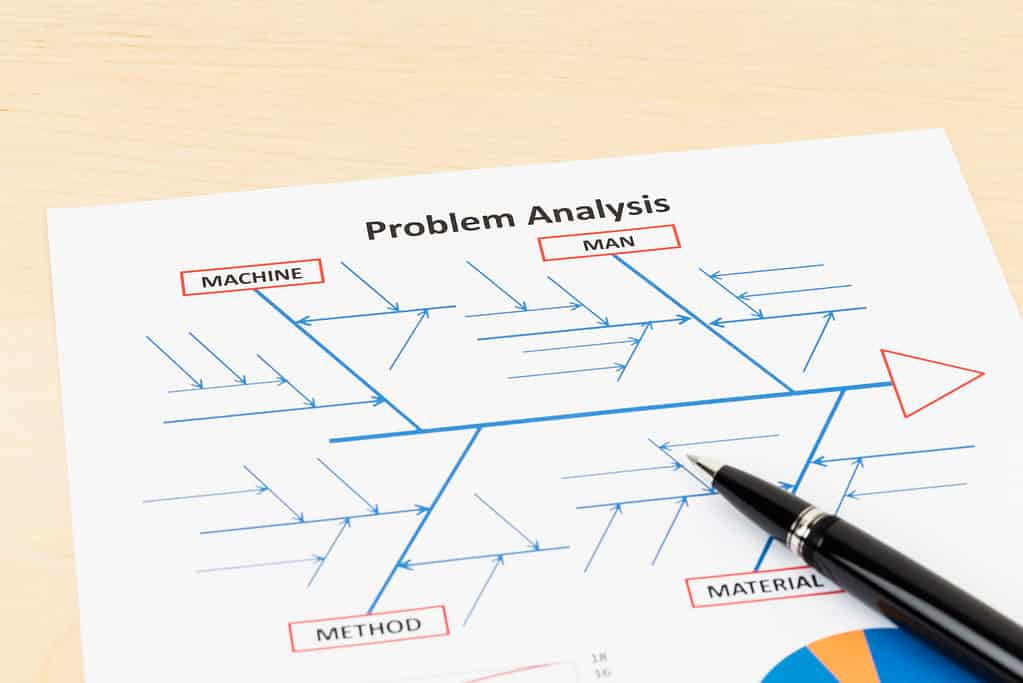
The Dos and Don’ts of Conducting Root Cause Analysis
Updated:In the context of Six Sigma and Continuous Improvement, a root cause is defined as an issue or factor that causes a nonconformance or defect which, if eliminated, will improve the process. The root cause is the base issue which sets a cause-and-effect reaction in motion eventually resulting in a problem. Overview: What is root […]
Read more »
Recommitment to Six Sigma Achieves Maximum Results
Published:Honeywell was a company that had been utilizing the Six Sigma methodology for years. Distracted by a merger and other factors, however, the organization had begun to slip. With a revitalized stake in the Six Sigma process, the organization was able to turn itself around and become even stronger than before. DMAIC and Y=f(x) Helped […]
Read more »
Successful Reinvention Focused on Customers and Quality
Published:In 2008, Starbucks was taking a major hit from the financial crisis, losing customers to competitors, and having to close hundreds of stores. Despite having its back against the wall, some decisions made around key Six Sigma principles helped Starbucks bounce back better than ever. How Giving Quality and a Better Experience To Employees and […]
Read more »