
Data analysis is a fundamental process in any project. However, data can be lumped into different types, with categorical and continuous data seeming almost opposed at first glance. That said, mastering these data types and understanding when and where to use them can lead to far more precision during data analysis as a whole.
What is Categorical Data?

Categorical data is statistical information presented according to its division into certain groups. In this model, values are sorted into predefined categories according to the analysts’ design. Grouping data points into categories in this way can be useful depending on the research goals, but it’s only one of many ways to orient statistical information.
The Benefits of Categorical Data
There are several reasons to use a categorical data model in an analysis. One of the most obvious benefits is the ability to quickly recognize trends, changes, and patterns based on inter-related variables. Categorical data is also useful for ensuring control and establishing relevance. It can also make the information easier to digest and understand.
How to Create Categorical Data
Creating categorical data is a simple matter of defining categories at the start of the analysis and sorting all individual values into these groups. The best way to categorize depends on the questions being asked. If a store owner records all of their transactions as either “cash” or “card,” then he can use this as a quick reference when checking the register at the end of each day.
What is Continuous Data?

Continuous data describes information that can take virtually any value. This includes things like height, weight, or any kind of numerical measurement. The type of information that produces continuous data is often likely to change with time as well.
The Benefits of Continuous Data
Continuous data is a basic format for the type of information that companies use every single day. Accuracy is the primary benefit of this type of statistical information. It’s the standard format for quantifying and understanding the implications of the information itself.
How to Create Continuous Data
The best way to collect and present continuous data is to simply be as accurate and thorough as possible. This type of data can be represented graphically by orienting the information around key variables or as part of a collated database. In either case, the goal is to collect as much measurable information about each data point as possible.
Categorical vs. Continuous Data: What’s the Difference?
Categorical and continuous data are not mutually exclusive despite their opposing definitions. The most important difference between the terms is that “continuous data” describes the type of information collected or entered into the study. In contrast, “categorical data” describes a way of sorting and presenting the information in the report.
Categorical vs. Continuous Data: Who Would Use Categorical and Continuous Data?
Every company has reason to use both of these terms in their statistical analysis, which is also central to lean manufacturing and management practices. Categorical data is more often used when quantitative measurements are impossible or impractical. One example is asking customers to rate their experience as one of several categories.
Continuous data can be turned into categorical data, but it doesn’t necessarily have to be presented this way. For example, when people register for a company’s website they have to choose their age from a list of years. Even though they could enter their age in years, months, days, and exact minutes, presenting the information as continuous data would not be particularly useful.
How Are These Data Types Presented?
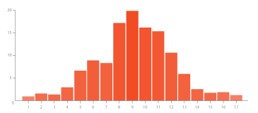
One of the most common methods of depicting categorical data is the humble frequency distribution. You’ve likely seen these in use since grade school, and they are still ever-present in the workplace. Since categorical data has discrete values by default, it makes for easier ways to present this data type for the average layperson to understand.
Conversely, where does that leave continuous data? As we’ve already discussed, since this is a more precise measurement of a given attribute, the presentations are equally precise. Common methods of depicting continuous data come in the form of ANOVA tests, linear regression models, and correlation analysis.
Categorical vs. Continuous Data: Real-World Scenarios
Choosing whether to present data in categories or according to quantitative value depends on what you want to accomplish. You need to know what questions you need to answer or what patterns you expect to find before organizing the data. Reporting continuous data helps analysts study the numbers and their implications free of any established structure while reporting categorically puts information in context based on existing priorities.
As an example, consider a person who is rating their progress with personal fitness and weight loss. They weigh themselves every week and take a record of it to compare with future results. This is continuous data with objective and quantitative data points starting with 180.5 pounds and ranging down to 155.2 pounds. The method works great for assessing general physical weight loss.
However, the person also rates their energy level as either “low,” “decent’ or “high” each day. This information is subjective but still relevant for understanding changes in personal health and fitness. Any data point entered here must be in one of the three categories, so it’s ultimately highly relative and categorical data.
Data, Data, and More Data
While we’ve covered just two data types present in the Lean Six Sigma methodology, there is no shortage of other types to keep track of. Much like this guide, our comprehensive look at variable and attribute data takes an in-depth approach toward two disparate data types so practitioners can better leverage them for their statistical analysis.
Additionally, you might be leveraging these data types toward some sort of testing. Understanding the difference between a null hypothesis and a standard hypothesis is paramount. As such, you might want to take a moment to read over our guide comparing and contrasting the two methodologies.
Get to the Point of Data
Leveraging data is not always easy. That’s why there are entire industries and professions dedicated to the art of gathering, collating, and processing information. Despite the overwhelming opportunity and scope of modern data analysis, business leaders need to keep things centered around the fundamentals. When you truly harness the power of information, you’ll know exactly where you are, where you want to go, and how you can get there.