This is part three of a four-part look at three Lean tools for product development. Click here to read part one, here to read part two about the customer journey value stream and here to read part four about quality function deployment.
The customer journey value stream (CJVS) is the best tool for the job in understanding the entirety of the customer experience. Just like Lean, its approach is a mile wide and an inch deep. It allows Lean innovators to holistically appreciate the entire scope of the customer’s product interaction value stream. But we must understand the needs and values of the customers at a deeper level. To this end we employ Kano analysis. Developed by Noriaki Kano in 1984, the Kano model provides a way of understanding how different attributes of a product can satisfy the wants and needs of customers in very different ways (i.e., deliver value). The Kano model establishes a relationship between product performance and customer satisfaction.
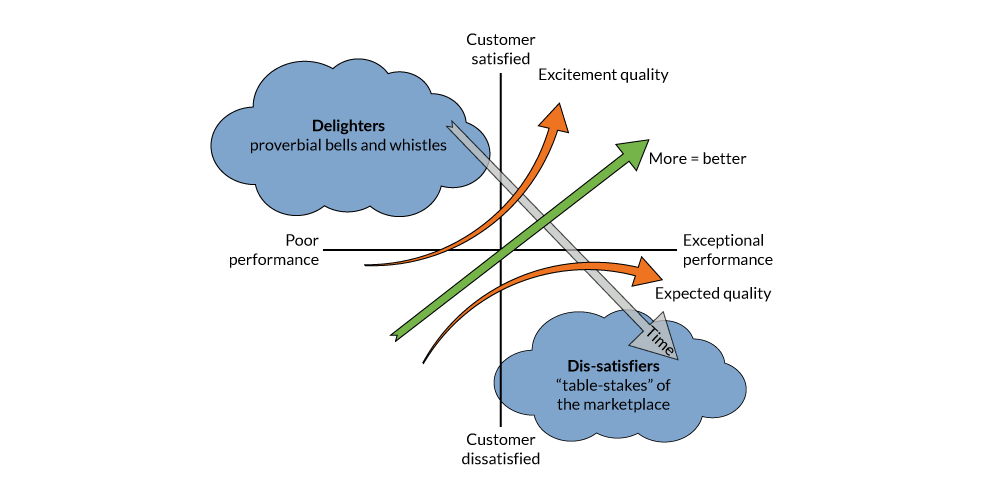
The first step to understanding the Kano model is to visualize the relationship between product performance and customer satisfaction. The Kano diagram helps us with this visualization.
The Kano diagram is made up of two axes and creates a landscape where we see a relationship of customer satisfaction and product performance. The Y axis measures customer satisfaction. The more satisfied a customer is by a particular attribute of the product (e.g., vehicle safety), the higher her satisfaction will be plotted on the chart. Conversely, the more unsatisfied the customer, the lower her satisfaction will be plotted. Different attributes of a product will deliver different levels of satisfaction to the customer. The X axis is similar. It measures performance and allows us to visualize how well the product performs across different product attributes. The better the product performs in an attribute, the further to the right it will be plotted. Like customer satisfaction, a single product will have many attributes, each with its own level of performance. By combining the satisfaction information (Y-axis) with the performance information (X-axis) for any product attribute, we can visualize how satisfaction and performance relate.
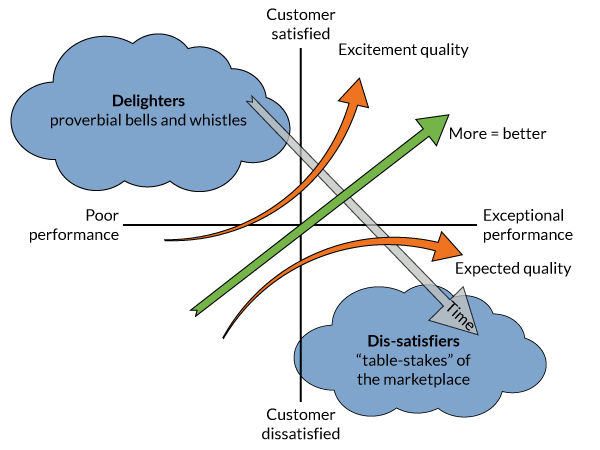
Finally, when this mapping exercise is applied across all of the product attributes, product, patterns and trends begin to appear. The Kano model generalizes these trends into three distinct areas depicted in Figure 1.
Dis-satisfiers
First, the “dis-satisfiers.” Think of dis-satisfiers as attributes the product must have no matter what. If a product does not possess these attributes, there’s no market for the product. You won’t find a new vehicle without A/C, power steering, windshield wipers, aligned axles and an engine that starts every time you turn the key. Additionally, even when these things perform exceptionally well, we’re likely not to notice or care. Car commercials won’t mention with what careful precision they’ve engineered the car alarm or how crystal clear the windshield is. We may be much more dissatisfied if they don’t work, but since they are merely expectations, there is an upper threshold of customer satisfaction.
Performance Characteristics
Second, we have performance characteristics. The better the product delivers on these attributes the more it satisfies the customer. Products that advertise “more,” “better” and “faster,” all operate in this dimension. When these performance characteristics are plotted on the Kano diagram, they form a positive linear relationship between their performance and their satisfaction. Performance affects satisfaction.
Delighters
Finally, we have delighters. The proverbial bells and whistles. They provide a high level of customer satisfaction just by being a part of the product. We’re delighted by a car that parks itself and look forward to being similarly delighted by autonomous vehicles in the future. Even if the autonomous features perform poorly (takes too long to park, breaks too hard or jerks the car around without smooth acceleration), there is still a high level of customer delight and satisfaction just from the feature’s inclusion in the product.
Time
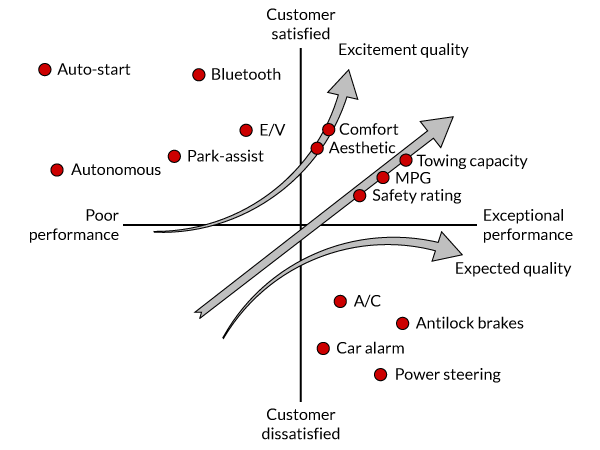
The final part of the Kano model is time. Time has a habit of making what is cool today the artifact of tomorrow. As time progresses, it pulls the delights and performance characteristics down into the “must-haves” of the market. For vehicles, fuel economy expectations, for example, are vastly different than they were 30 years ago. Once the delights of only top-end luxury vehicles, power windows, Bluetooth connectivity and cruise control are now standard in even the lowest-tier stock model of every automobile manufacturer. Figure 2 demonstrates where different attributes of a new vehicle maps.
From the Kano model, we can take away a two key points of interest.
- Continuous improvement has its place in delivering customer value. That positive linear relationship we called “performance characteristics” is ripe for continuous improvement. Customers like faster, cheaper, better products and services. Continuous improvement delivers on these wants. Organizations can deliver value simply by improving performance.
- The “delights” are where the new and novel get created. No customer is expecting their inclusion. The deliver a high level of customer satisfaction simply by being incorporated into the product. These delighters are what evoke the emotions of novelty and newness to a product.
How to Perform a Kano Analysis
The Kano model might be all well and good for Dr. Kano, but how can we take it out of the theoretical world and into the field? How do innovators identify the product attributes customers want, let alone map them to an abstract diagram? To answer these questions we have to return once again to the gemba.
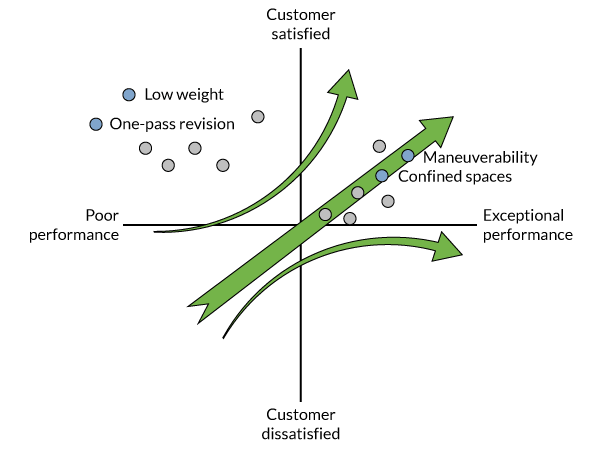
Imagine a product team charged with designing a new home carpet cleaner for a major vacuum manufacturer. The team would take to the gemba and identify the key customer requirements based on what they observed. In this example, attributes like cleaning of confined spaces, maneuverability and weight are important requirements.
After the gemba, the team begins the process of what I’ll call the “Kano method” for classifying customer requirements. Based on the customer requirements identified above, the team creates a survey. The survey is formulated into a matched-pair of survey questions. For a given requirement, like cleaning confined spaces, a customer gets asked two questions about the weight of the cleaner:
- The first question framed the requirement in terms of good performance: “The carpet cleaner is able to clean tight spaces.”
- Another question framed the requirement in terms of bad performance: “It is difficult for the carpet cleaner to clean corners and small closets.” The respondent is asked to categorize how they feel about the statement (Like, Expect, Don’t Care, Tolerate, Dislike).
Similar to double-entry bookkeeping for an accountant, the purpose of two questions is to verify the survey responses. The matched-pairs make sure the customer really feels a certain way about a product’s attributes.
In a sense, this is the final step of the gemba. The innovation team is still actively seeking insights about the customer experience directly from the customer. After this is completed, the team can move further into the Kano analysis. Taking the survey responses, the innovation team maps the response pairs to a logical matrix where:
- Q: Questionable – The response-pairs were incongruent with one another.
- P: Performance characteristics – The customer identifies this as a performance characteristic.
- I: Indifferent – The customer is indifferent to this attribute
- M: Must-Be – The customer expects this as part of the product
- R: Reversal – The functionality of the product is the exact opposite of what was expected. (To the customer, dysfunction = function.)
- A: Attractive – These attributes delight the customer.
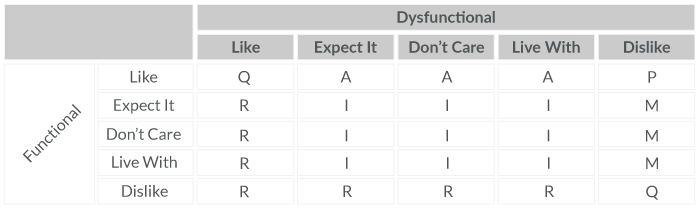
The logic in Figure 3 isn’t complicated. The matched pairs don’t have to match exactly. If a respondent “likes” a functional statement and “expects” a dysfunctional statement, this registers as “attractive.” In other words, this would delight a customer. The innovation team tallies each respondent’s rating for each product attribute and then assigns it a dominant rating for the rating based on the tally count. Just like the Kano diagram, the three ratings of interest are “attractive,” “must haves” and “performance.” For visual purposes, these dominant ratings can be mapped to the Kano diagram shown in Figure 4.
For the innovation team, the final step of the Kano analysis is simply to prioritize the different attributes for each rating. Oftentimes this is done by asking respondents to rank the importance level for each question in the matched pair survey. This ensures that the innovation team considers the most important delights and performance attributes before the less important.
Conclusion
The Kano analysis offers us a thorough and analytical way to understand customer requirements for a particular product. Contrasting this approach from the first tool, of the CJVS, the Kano analysis is narrower in scope. It is concerned only with the product attributes and not the entire value stream. And yet, it still exhibits something “Lean.” The Kano analysis pulls value from the customers – it lets the interactions of the gemba drive the product forward. There is no place for pushing designs onto the customer. The tools are different, but not in a competitive way. One tools does not build off the next, but neither do they detract from one another. They are complementary.
Click here to read part four about quality function deployment.