
One of the first activities in starting a Lean Six Sigma project is to construct a process map in the Define phase of DMAIC. The idea of graphically representing your process steps will continue throughout your project.
This article will present five of the most common process maps.
Overview: What is a process map?
Process maps will range from a 30,000-foot macro-level view to ground level, where actual tasks are described. They may fit on a single piece of paper or cover an entire wall. Here are five of the most common process maps:
- SIPOC
- Top down
- Swim lane
- Value stream
- Spaghetti map
Let’s look at each one in a little more detail.
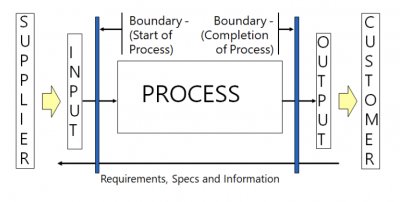
- SIPOC (Supplier, Input, Process, Output, Customer) is a high-level macro graph of a process from end to end. To create one, the questions you will answer are:
- What is the start and stop of your process in 5-8 high-level steps?
- What are all the outputs of those steps, including both the good and bad outputs?
- Who are the customers of those outputs?
- What inputs did you need to initiate and run the process?
- What suppliers provided those inputs?
- What are some possible key metrics you would use for the inputs, process, and output?
- A top-down process map is meant to provide focus by carefully drilling from the highest level down to the level where the root cause is located. Here is the technique:
- Use the Start and Finish points of the process from the SIPOC map.
- Define 6 to 12 high level activities between the Start and Finish.
- Drill down from the single high level activity most likely to contain the root cause into 6 to 12 medium-level activities.
- Continue drilling down until you reach the level of the cause(s) of the problem.
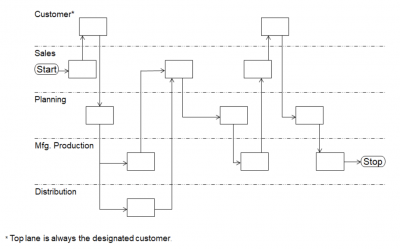
- A swim lane process map is used to show handoffs between the functional areas involved in your process. The steps of the process are laid out sequentially and overlaid on the appropriate functional area. The format looks similar to the swim lanes in a pool, hence the name.
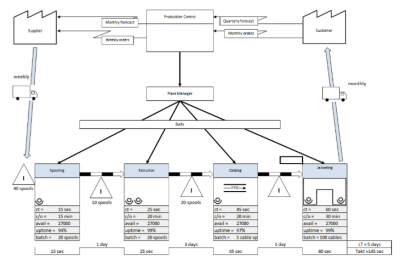
- A value stream map (VSM) is a detailed process map showing all the steps of the process, material, and information flows as well as a timeline. These are the steps for developing a VSM:
- Step 1 – Create a SIPOC chart
- Step 2 – Map the current state with a Top Down or Swim Lane chart
- Step 3 – Determine the product/process family to VSM
- Step 4 – Draw the process flow chart
- Step 5 – Add the material flow
- Step 6 – Add the information flow
- Step 7 – Add the process data collection boxes
- Step 8 – Add process and lead time data
- Step 9 – Verify the current state map
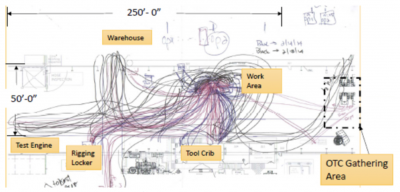
- A spaghetti map is a process map of the movement of an object within a physical site. It could be a person, information, product, or paper form. The key is to reduce the distance and number of times an object is moving around.
3 benefits of a process map
A visual representation is usually easier to comprehend than lines and lines of written text.
1. Documents your process
A process map serves as a simple and visual way of documenting what work is occurring in your processes. Maintaining a repository of your process maps can be a valuable resource for people to understand what happens in your organization.
2. Areas for improvement
Process mapping shows what is actually happening, who is involved, where information, data, and materials are flowing, and most importantly, handoffs between processes, departments, and supply chains. Doing an analysis will help identify which steps are value-added and improved or non-value added and should be eliminated.
3. Best practices
Your process map can be the basis for everyone consistently doing the agreed-upon best practices documented in your process map.
Why is a process map important to understand?
Before you can improve anything, you must first understand what is going on in your process.
Capture current as-is condition
There are three ways to map your process: what you would like it to be, what it should be, and what it actually is. Always start with the current as-is condition.
Need to support with data
Many process maps have a large component of subjectivity about what is really going on. Confirming reality with data will keep you from making erroneous assumptions about the process.
Always confirm by doing a Gemba walk
Process mapping typically takes place in a room with participants coming from various areas of the organization. The process map of the as-is condition needs to be confirmed by walking the physical process.
An industry example of a process map
Carl just became the manager of the HR group of a large utility company. Since he came from outside of HR, he felt he needed a better understanding of all the processes that went on in HR. He asked Gail, one of the internal Master Black Belts, to help him.
Gail pulled together a group of HR staff to help with the process mapping. She started by doing a high-level SIPOC to cover the macro processes, including recruiting, onboarding, benefits, and training. She then drilled down on those and created 14 as-is current state subprocess maps. She had the team do a value analysis of the subprocess maps to identify potential improvement opportunities.
Carl used all the process maps to gain a deeper understanding of what is going on in HR and to start thinking about chartering projects for improving the key HR processes.
3 best practices when thinking about a process map
Even making a process map is a process. Here are a few tips to make this process more efficient and useful.
1. Start high and dive deeper
Start at the macro level of your process, and then dive down until you reach the appropriate level at which something is actionable for the group doing the process map.
2. Be aware of the behavioral environment
Be aware that some people may be reluctant to describe the as-is current state condition of the process. If the behavioral and organization environment does not appreciate transparency and honesty, then people may not describe where the true fail points or problems are.
3. Engage the people doing the work
You should engage and include people doing the actual work plus customers and suppliers of the process. People will eventually need to buy into the final process map and use it as the basis for how the process should function.
Frequently Asked Questions (FAQ) about a process map
What is a SIPOC process map?
It is a high-level map of the macro process. The elements of SIPOC are Supplier, Input, Process, Output, and Customer.
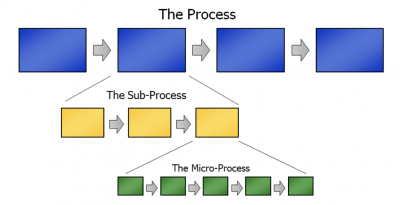
What is a Level 1 process map?
Level 1 is the overall macro process. Level 2 would be a next level process map, and so on. A Level 5 map would be down at the task level.
Is there a good computer program for doing a process map?
Some of the common computer programs for building process maps are MIRO, Microsoft Visio, and Minitab Workspace.
Process map in a few words
A process is a series of steps, activities and tasks that take inputs from a supplier and transform them into outputs for a customer. All work is a process. A process map is a graphical representation of your process and provides a visual, at-a-glance view of your process. Some of the more common process maps are: SIPOC, swim lane, value stream, top down, and spaghetti.