Span is a measure of variation in your data. Developed by GE, span was used when there were outliers or the distribution of the data was not normal. Let’s see how it’s calculated and used in lieu of the range.
Overview: What is span?
In statistics, it is very important to describe the spread, variation or dispersion of your data. Excessive variation makes it harder for you to plan and manage your process. The three most common measures of variation are the range, standard deviation and variance. The range is the measure most similar to span.
Range is calculated by subtracting the smallest value in your data set from the highest value. The range is always a positive number, with zero being the smallest when the highest and lowest values are the same. Unfortunately, the range can be deceiving if the highest and lowest numbers are extreme outliers or the distribution is non-normal.
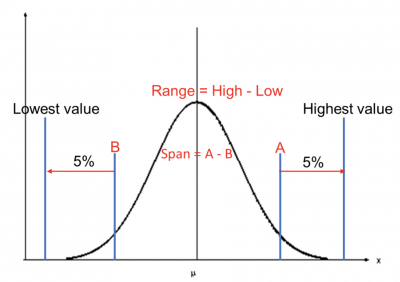
To offset that problem, span is calculated by eliminating some percentage of the data in the tails of the distribution. GE, the developer of the concept, dropped 5% of the data from each tail so other statistical calculations were done using the data between 5% and 95% of the distribution. The trimmed or truncated mean used the span as the basis for a measure of central tendency.
The graph below shows the concept of span versus range.

For an excellent discussion on span and its history, check out this link on isixsigma.com.
An industry example of span
The transportation and delivery manager of a consumer products company was interested in understanding the variation of his customer deliveries. One of his staff had been previously employed at GE and had used the concept of span to measure customer delivery. He helped the manager do the calculations.
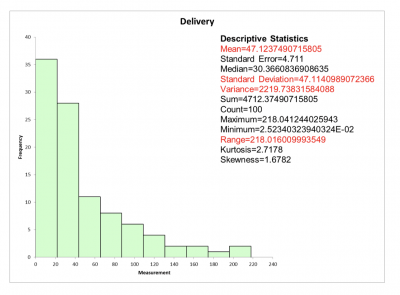
Data was collected on delivery times. As expected, the distribution was skewed, as shown below in the histogram. Note the various traditional calculations for variation highlighted in red.

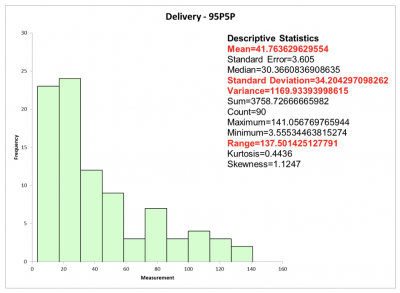
The manager was just as concerned about delivering too early as he was delivering late. Knowing there were some exceptionally early and late deliveries, he decided to redo his calculations and compute span by eliminating the top and bottom 5% of the delivery data.
See the resulting graph and statistics below. This became his goal for reducing the overall variation of deliveries.

Frequently Asked Questions (FAQ) about span
1. For what kind of data does span work the best?
For a normal distribution, the standard deviation is the preferred measure of variation. When you have non-normal data, span will give you a simple representation of the data variation.
2. Must span always be based on the 5/95 probabilities?
No. While it is a good starting point, you can adjust that number to what makes sense for your organization. As the process improves, you can change it to 1/99 as GE, the creator of span, did once it improved its processes.
3. How does the concept of trimmed mean fit in with span?
Most people are used to calculating the mean of a set of data by adding up all the values and then dividing by the number of values. The trimmed or truncated mean first eliminates the 5% of the data from each tail before calculating the mean, hence the name trimmed and truncated.