
One of the downsides of using the arithmetic mean of a quantitative set of data to measure the central tendency, is that the mean can be skewed by outliers in the data.
Overview: What is the trimmed mean?
If your data set has extreme high or low values, calculating an arithmetic mean might not be a true reflection of the central tendency of that data. Often, the median is used as a measure of central tendency when there are outliers in your data. The median is defined as the middle value or physical center of the data when the data is sorted high to low or low to high. Half the values will be above the median and half the values below. The median is not impacted by outliers.
The trimmed or truncated mean removes a percentage of the values from either end of your data set. A percentage of 5% from either end is a common approach but other percentages can be used as well. By removing these values, you will reduce the impact of any outliers when you calculate the arithmetic mean of the remaining values.
The concept of a trimmed metric can also be applied to other statistical measures. For example, to calculate the range of your data, you would take the mathematical difference between the highest and lowest values in your data. But, if you had any extreme values or outliers, your calculated range might not be truly reflective of the variation in your data. Span is the calculated range once you eliminate a percentage of values on either end of your distribution. You might consider this to be a trimmed range.
An industry example of a trimmed mean
The company Six Sigma Black Belt noticed the data she was analyzing had some extreme values so her calculated mean was not really representative of the central tendency of her data. She decided to use a 10% trimmed mean where she removed 10% of the data from both ends of the data set. Below are her calculations:
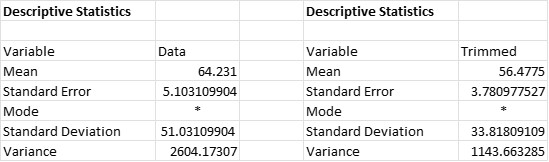
Note how the original mean of all the data was 64.231 while the trimmed mean was 56.4775. That is because of the 10% removal of the extreme high and low values.
Frequently Asked Questions (FAQ) about the trimmed mean
What is the trimmed mean used for?
The trimmed mean is the calculated mean for a set of quantitative data after a percentage of the data points are removed from either end of the data set. The purpose is to provide a more accurate measure of the central tendency of your data by eliminating the influence of any outliers or extreme values in the data.
What is the difference between span and trimmed mean?
The trimmed mean is the calculated mean of your data once a percentage has been eliminated from each side of the distribution. Span is the calculated range of your data once a percentage of data has been eliminated from either end of the distribution. One is a measure of central tendency and the other a measure of variation.
Can I use something other than removing 5% of either side of the distribution?
Yes. You can use any percentage that would make sense for what you are trying to analyze or calculate.