
What are standardized residuals? How do I calculate it? How do I use it and interpret it? What are its benefits? The answers to these questions and more can be found below.
Overview: What Are Standardized Residuals?
Before you can understand what a standardized residual is, you must first understand what a residual is.
A common use of a residual, also known as a raw residual, is in regression analysis. A residual is the vertical distance from a data point to the prediction line. It indicates the prediction’s error. The prediction line is essentially the average of the data points, and the residuals are how far each point is away from that average.
In other words, it is the mathematical difference between the observed value of y given the paired x value, and the predicted value of y given that same x value. Large residuals indicate large errors, whereas small residuals indicate that your prediction line fits your data well.
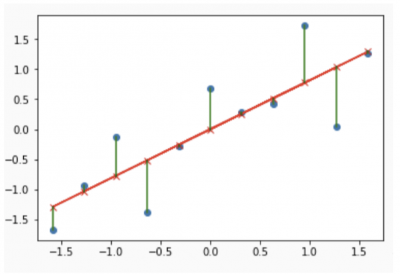
Image source: Stack Overflow.
Notice that some residuals will be negative and some will be positive. A graphical plot of your residuals is an important diagnostic of how well your data fits your predictive model. Your regression may have a high r-square value or high correlation, but the residual plot may suggest something else.
Defining Standardized Residuals
Now let’s define a standardized residual. A standardized residual is the raw residual divided by an estimate of the standard deviation of the residuals. It measures the strength of the difference between observed and expected values. Here’s how you calculate the standard deviation of the residuals for a simple linear equation.
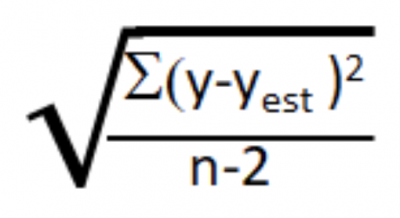
The standardized residual is then the ratio of the individual raw residual divided by the standard deviation.
The standardized residual can help you detect outliers. Standardizing residuals is useful because raw residuals might hinder your ability to identify outliers if they have non-constant variance. If residuals of observed values farther from your prediction line have greater variance than residuals with observed values closer to your prediction line, then outliers are harder to detect. By adjusting for this nonconstant variance, all standardized residuals will have the same standard deviation.
As mentioned earlier, your plot of residuals, whether they be raw or standardized, are important indicators of the validity of your regression model. Here is an example of what the typical standardized residual plots look like.
First, look to see if the normal probability plot looks normal. Then, see if the histogram looks normal as well. The other two plots should look random (Versus Fits and Versus Order). If they are, you can have faith that your regression is valid.
Standardized Residuals Visualized
Most statistical software will also identify residuals that are 2 or 3 standard deviations away from the prediction line. These are referred to as outliers and represent an unexpected value.
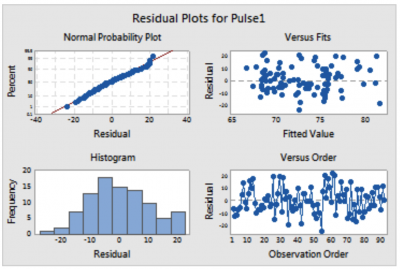
Image source: Pinzhi.org.
Here’s another set of standardized residual plots for some data that seems to have a little problem. What do you see?
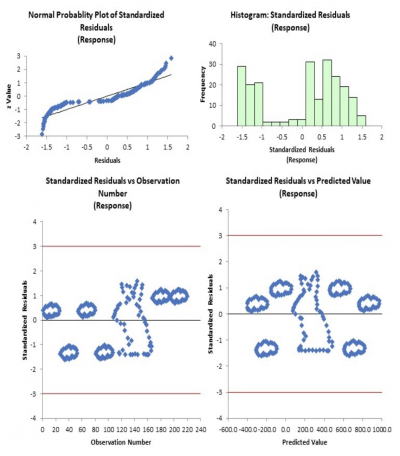
The first thing you should see here is that the normal probability plot doesn’t appear to be normally distributed (a straight line), which is a requirement. The histogram confirms that since it does not appear symmetrical around a center value. And finally…bunnies in the clouds? Those graphs should appear as a random pattern.
Your conclusion should be that there is a problem with the data, and although you might have calculated a strong correlation, the predictive model is not valid.
Studentized Residuals
Finally, let’s consider studentized residuals. Here is a great explanation from a Penn State University online course, which says about studentized residuals:
When trying to identify outliers, one problem that can arise is when there is a potential outlier that influences the regression model to such an extent that the estimated regression function is “pulled” towards the potential outlier, so that it isn’t flagged as an outlier using the standardized residual criterion. To address this issue, studentized residuals offer an alternative criterion for identifying outliers. The basic idea is to delete the observations one at a time, each time refitting the regression model on the remaining n-1 observations. Then, we compare the observed response values to their fitted values based on the models with the ith observation deleted. This produces deleted residuals. Standardizing the deleted residuals produces studentized residuals.
3 Benefits of Standardized Residuals
Now that we’ve explored several ways to use residuals, let’s look at the benefits of standardized residuals.
Offers a Generic Measure
One of the problems with using raw residuals was the potential problem of differing variances. By dividing the raw residual by a generic standard deviation, you now have a simple, standardized way to assess your residuals and your regression model.
Identifies Potential Outliers
A statistical analysis of the standardized residuals will help identify potential outliers, which often have an undesired impact on the error and quality of your prediction.
Confirms the Validity of Your Prediction Model
Even though you might show a strong correlation in your regression model, it is the evaluation of the standardized residual plots that will tell you whether your correlation and model are valid.
Why are Standardized Residuals Important to Understand?
An evaluation of any type of residual is important to understand since it’s a measure of the strength of the relationship between your observed values and predicted values.
Measure of Error
Residuals are the difference between observed values and predicted values. This error is important to understand so you can evaluate whether your predicted values will provide you with the information you need to assess the usefulness of your predictions.
Least Squares Regression
The least squares regression method is generally used for developing your prediction line and thus your prediction model. The calculation involves squaring the raw residuals and then moving the line around until the location of the line minimizes the sum of the squared residuals.
Interpretation of the Residual Plots
“It ain’t over ’til the residual plots says it’s over” is a good way to describe the importance of understanding the residual plots. Three graphical plots are used for the standardized residuals. They are:
- Normality plot (residuals should be normal and have a mean of zero and a standard deviation of 1)
- Plot of the standardized residuals versus predicted values (random)
- Plot of the standardized residual versus the order of the data (random)
An Industry Example of a Standardized Residual
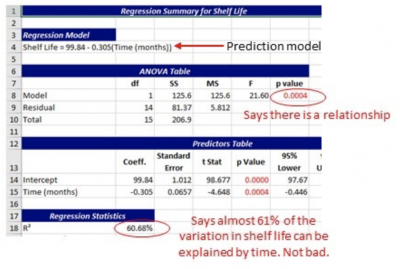
A pharmaceutical company was investigating the relationship between time and the continued efficacy of one of their liquid oncology products. Over time, they collected samples and tested the effectiveness of the product to determine the practical shelf life for the product.
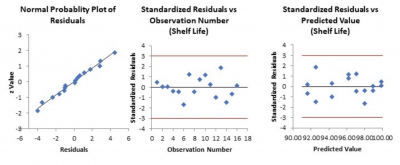
Below are the final statistical output and the standardized residual plots. It appears that the prediction model is valid. The next step was for the company to figure out how to extend the shelf life to reduce the amount of product that has to be disposed of because of declining efficacy.
Real-World Uses of Standardized Residuals
While we’ve been talking about some rather math-heavy subjects, it helps to see how these principles are applied in the real world. So, where would you use standardized residuals in your organization? While there are multiple ways to apply this to your statistical analysis, let’s look at the most basic point: costs.
Production takes time and money, and you’ve likely got data supporting projected costs for completing every step of a given process. However, Murphy’s Law often tells us that things will go pear-shaped at some point. So, now you’ve got two sets of data for the production. You have the projected cost and the actual cost of a given step.
Utilizing standardized residuals you can see if there are significant differences between the projected cost and residual cost. Further, you can see how these data points differ from the workflow throughout the lifetime of a given production line. Determining this significance benefits your organization by figuring out where you’re losing money in a given step of your workflow.
Best Practices When Thinking About Standardized Residuals
The standardized residuals are just a mathematical calculation. Properly collecting data and doing your regression is the part you should be concerned with.
Paired Data
To do a regression analysis requires that there be a paired set of data. That is, for each x value, there needs to be a corresponding y value.
Use Statistical Software
Doing the calculations of the standard deviation, least squares regression, standardized residuals, and all of the residual plots by hand is not recommended. Fun for some, but not recommended for accuracy.
Outliers
An unusual point will result in a high residual and can pull your prediction line away from the true center of the data. This could hurt your prediction.
Most statistical software will highlight any standardized residual that is 2 or 3 standard deviations away from the prediction line. You will want to investigate and decide how to address that data point. A statistical calculation called Cook’s Distance will help you identify statistically significant outliers.
Power Up Your Statistical Analysis
The analysis stage of DMAIC can be a slog, at least if you’re doing things by hand. However, you don’t have to rough things out the old-fashioned way. If you’re running tests like an ANOVA, you’ll benefit from running a Tukey’s test afterward. To get the gist of how to calculate this, you can use our handy guide as a refresher.
Further, you might be seeing defects or problems arising in your workflow. So, why not utilize the 6Ms? While this concept has some variations, it is more than capable of solving a problem with minimal fuss. You can read all about how this concept can benefit your organization here.
Summing Up Standardized Residuals
A raw residual is the difference between an observed value and a predicted value in a regression or other relevant statistical tool. A standardized residual is the raw residuals divided by an overall standard deviation of the raw residuals. This provides a consistent measure of the error of your prediction.
Before deciding on the value of your prediction model, confirm the validity of your model with the use of residual plots. There are some assumptions about the nature of residuals that must be met. They are: residuals need to be normally distributed with a mean of zero and a standard deviation of 1. They also need to be random concerning your predicted values and with the order of your data.