
ANOVA will tell you whether there is a statistically significant difference in the population means of three or more groups of data. But which means are different? Tukey’s will tell you that.
Analysis of Variance (ANOVA) is used to determine whether the population means of several sample data sets are statistically different or not. If they are different, which ones are different from each other? Tukey’s multiple comparison test, developed by statistician John Tukey, is also called Tukey’s honestly significant difference test or Tukey’s HSD.
This method is often used as a post hoc test for an ANOVA, to create confidence intervals for all pairwise differences between each group’s means, while controlling the overall error rate to a level that you choose.
Overview: What is Tukey’s?
After you have run an ANOVA and found significant results, then you can run Tukey’s HSD to find out which specific group means, when compared with each other, are different. The test compares all possible pairs of group means.
There are several assumptions you need to meet before doing your Tukey test:
- Observations are independent within and between groups.
- The groups for each mean in the test are normally distributed.
- There is equal within-group variance across the groups associated with each mean in the test. You can use the Bartlett homogeneity of variance test.
One of the downsides of doing multiple comparison tests is that the overall Type 1 error rate will be inflated. This family-wise error rate must be controlled to have meaningful results. In Tukey’s test results, the formula indicates how large an observed difference must be to call it significant. Any absolute difference between means has to exceed the value of HSD to be statistically significant. You get to choose your error rate.
The Tukey test output is usually a series of confidence intervals of the difference in means between the combinations of groups. If that confidence interval contains the value of zero, you will interpret that to mean the two group means you compared are not statistically different.
An Industry Example
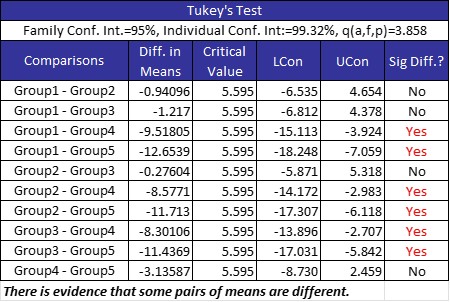
The manager of manufacturing wanted to determine whether the run speeds of his five machines were equal. He was advised to use an ANOVA to determine if there was any difference. The p-value from the ANOVA indicated the null hypothesis of no difference had to be rejected. He then used Tukey’s to determine which machines were different from each other.
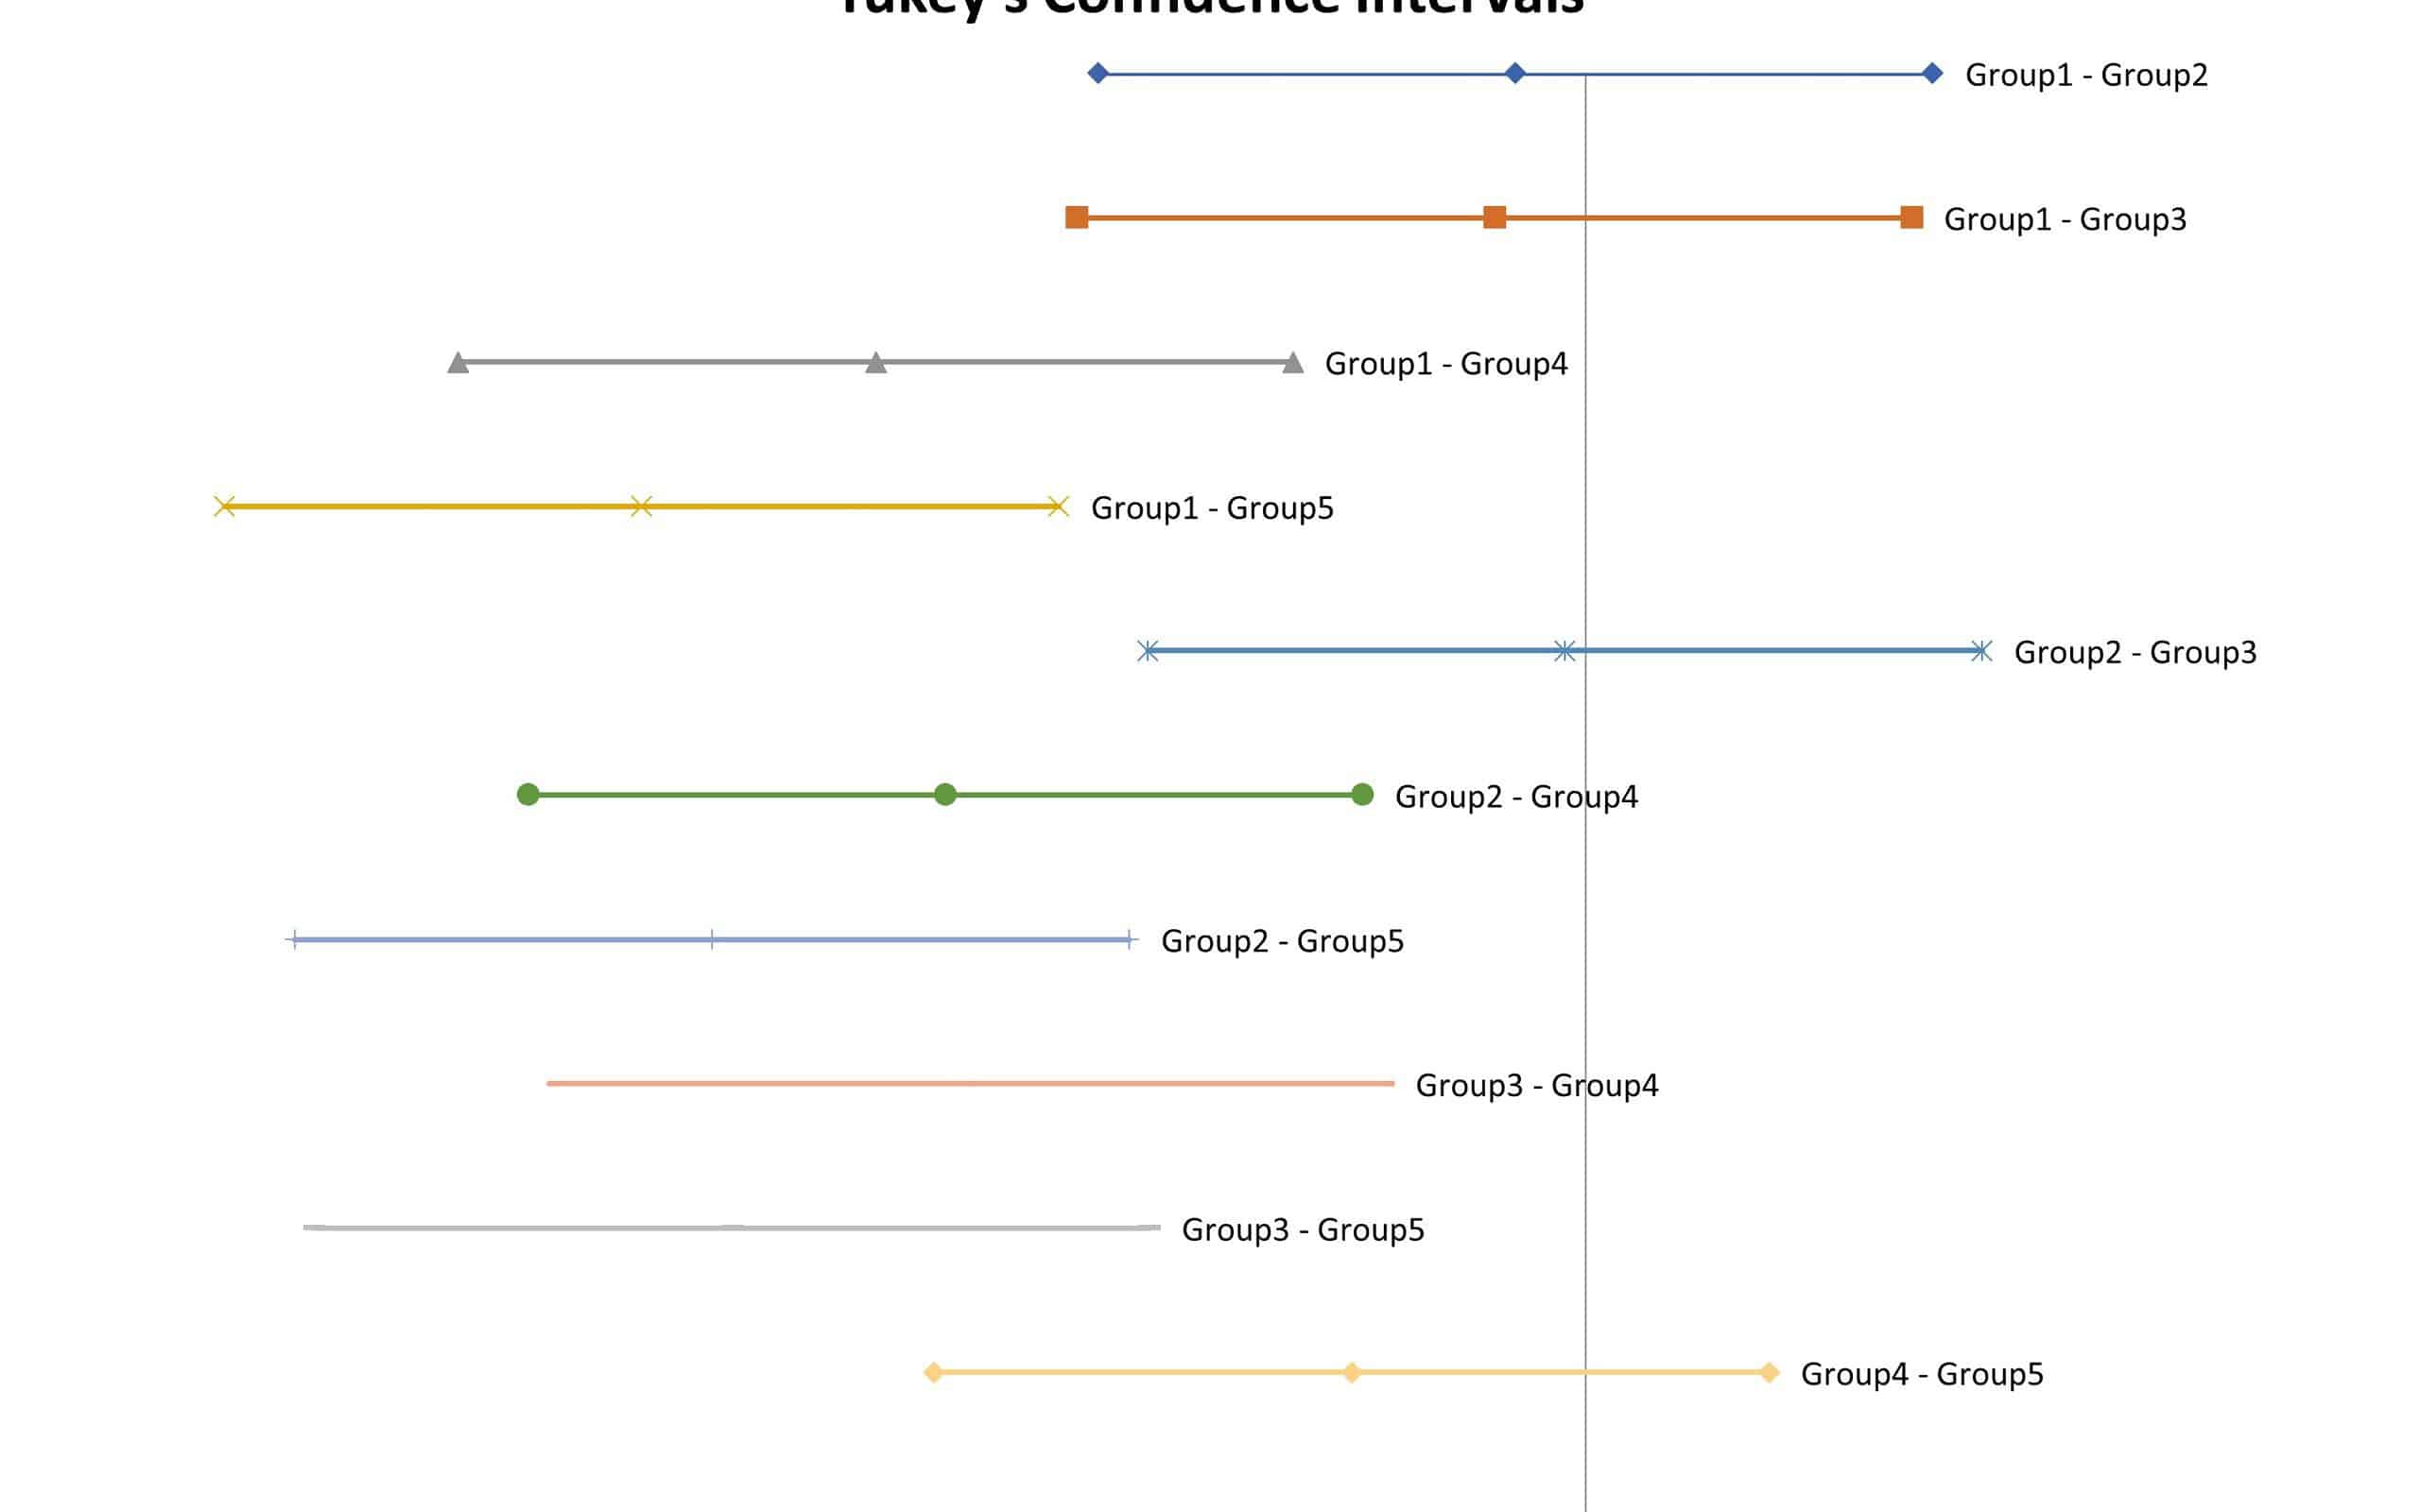
Below you can see the results in table format and graphical format. In the graphical format, if the vertical line of zero falls within a paired comparison of two machines, then there is no statistically significant difference between the two machine speeds. The other confidence intervals will show the range of possible machine speed differences.
Why Should You Use Tukey’s?
If you’ve run numerous tests like an ANOVA, you likely have a glut of data to comb through. Taking pairs of these data sets and running an HSD test allows you to see if there are significant differences between those pairs.
Running these tests in succession with multiple data sets can save you countless hours of analyzing results and banging your head against the desk. As I’m sure many of you know, time is money, and anything that can save time has great benefits. Tukey’s or the HSD isn’t a cure-all for data analysis, but it is a useful tool to consider.
Making the Most of Your Data
While we’ve been talking about Tukey’s, we’ve neglected some of the other useful elements present in Six Sigma methodology. One of the elements discussed throughout today’s guide is the null hypothesis. If you’d like to learn how this concept applies to your data, you can read our guide comparing it with a general hypothesis.
Additionally, you might be looking to reduce defects in your production. How do you cut out some of the more tedious calculations and get results fast? Accordingly, you’d need to calculate your DPMO, but our short guide on how to convert between DPMO, Sigma Level, and Cpk is a must-read.
Closing Thoughts
If you’ve run the ANOVA tests, then implementing Tukey’s test to your data is a reasonable next step. Data analysis can often have you bogged down in the details, especially when trying to determine the differences between the means of different data sets. Running a Tukey test after an ANOVA test can yield satisfying results without a ton of leg work.