
This is a Green Belt project the author led at a large financial data services company. The project was designed to reduce the overall cycle time for procurement to issue a fully approved requisition into a purchase order dispatched to the supplier. Following the Lean Six Sigma (LSS) methodology, part 1 of the case study includes the Define and Measure stages of DMAIC. Part 2 features the Analyze, Improve and Control stages.
Define
In the 16 months prior to the start of this project, the Strategic Sourcing department generated approximately $10 million in savings, an amount verified by independent associates in the Finance department. While Strategic Sourcing associates at the company are responsible for the large impact to the company’s bottom line, they are also burdened with the tactical work associated with issuing a purchase order to the supplier. The time spent on this tactical work represents a loss in the department’s ability to affect the bottom line through negotiations and supplier relationship management.
Project Charter
Project name: Requisition to purchase order process
Problem statement: 85 percent of purchase orders (POs) require manual intervention by buyers, resulting in an efficacy ratio of 44 POs/month/buyer. Company does not have a consistent process for the creation of POs in the system once a requisition is approved.
Benchmark efficacy ratios:
-
- Median: 50 POs monthly per buyer*
- Laggard: 21 POs monthly per buyer*
* According to the American Productivity & Quality Center (APQC).
Business case: Global procurement has reported cost savings (SAR) in the amount of $9.6 million/quarter for the past 16 months. If the department can increase the productivity per buyer by 6 POs/month, this would result in 9,485 hours or 4.5 full-time employees’ (FTE) ability to instead focus on strategic value to the company. Global procurement could increase SAR by $2 million/year.
In scope: Requisitions that are manually sourced to a PO by a buyer. The process begins when a requisition is submitted in the system of record and ends when a PO is dispatched to a supplier.
Out of scope: Current catalog auto-sourced (purchase orders generated directly from an online catalog that do not require a sourcing intervention) and interface (orders that come directly into the system from a vendor site and do not require the involvement of a sourcing associate) POs. International POs or POs not sourced through procurement.
Goal statement: Within three months, create a consistent, documented repeatable process for creation of POs to boost the efficacy ratio of 44 POs/month/buyer to 50 POs/month/buyer.
Cycle Time
The cycle time for the purchase orders to be issued delayed the business units’ ability to receive the product and/or service associated with such savings (Figure 1). Additionally, the cycle time was interfering with the Sourcing associates’ ability to contribute toward the savings – avoidance or recovery – objectives (SAR). In addition to the dollar impact to the tactical work, multiple FTEs were needed to issue POs, creating inconsistency in timing as well as resource issues. The savings was estimated at approximately $2 million in addition to a reduction in the number of FTEs required to process the POs.
SIPOC Analysis
The SIPOC (suppliers, inputs, process, outputs, customers) analysis begins with an email that is distributed to all sourcing associates that details a list of the requisitions with approval that need to be sourced to a PO. Since the categories for each sourcing associate are blurred, it’s a challenge for each associate to know who to send them to – creating distribution issues and adding to the cycle time.
We issued a one-question survey to about 170 employees – those who issue the most requisitions throughout the company.
Based upon your experience, how long does it take procurement to process a fully approved requisition into a purchase order?
- 41% = less than a business week
- 31% = 2 weeks
- 24% = 1 month
- 4% = longer than a month
Voice of the Business (VOB)
A similar question was asked to assess the VOB.
What is your desired timeframe for how long it should take procurement to issue a fully approved requisition into a PO?
- 72% = less than a week/5 business days
Process Map
Looking at the as-is process map (Figure 3), there are a striking number of steps and failure points in the process. It’s amazing that purchase orders are dispatched with any frequency! There are more than 40 steps in the current process, which has a direct result on cycle time.
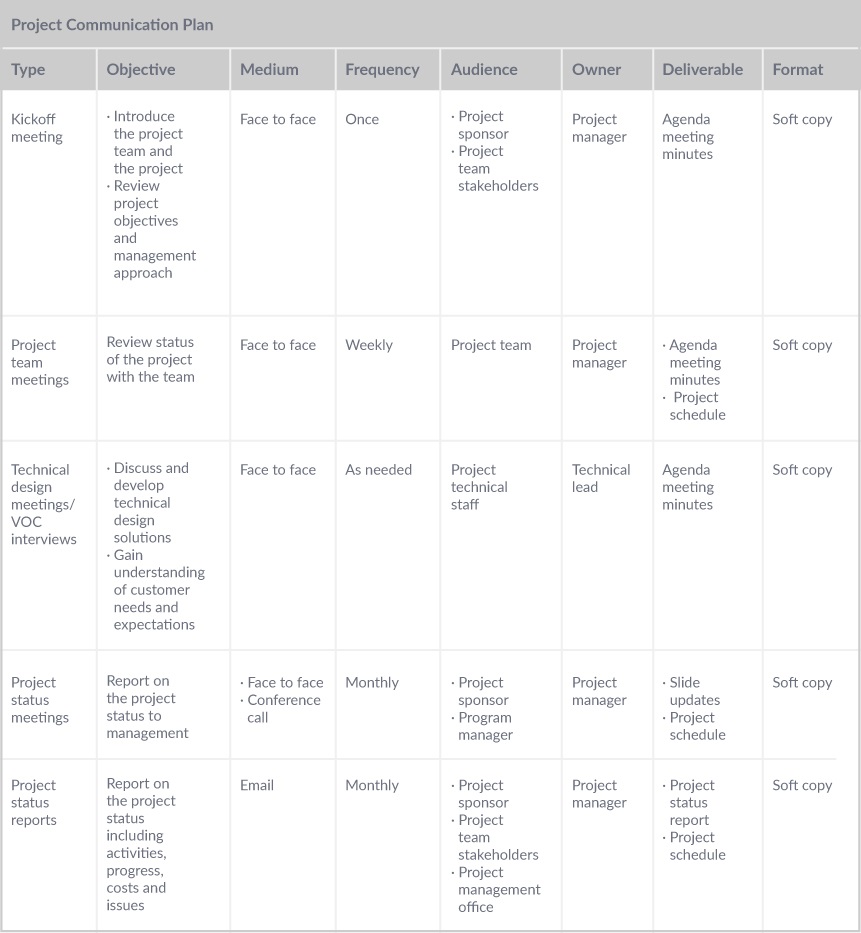
Communication Plan
The communication plan shown in the table below was developed and shared with the project’s stakeholders.
Measure
Updated Project Charter
Changes to the charter were made after discussions on the potential impact of the project. It was determined that the project should result in an increase in productivity per buyer by at least 6 POs per month. The process would likely require fewer procurement representatives to process all the POs and could result in an increase in auto-sourced POs – or even move these to the Procurement to Pay (P2P) team. This, in turn, would free up resources from procurement to focus on strategic activities. This increase in productivity by the same 13.6 percent (the increase from 44 POs/buyer/month to 50 POs/buyer/month) should increase the SAR by an additional $5.5 million.
Updated business case: Global Procurement reported SAR in the amount of $9.6 million/quarter for the past 16 months. If the team can increase the productivity per buyer by 6 POs, this would result in a 13.6 percent increase in POs/buyer and allow the P2P team to source all POs under $50,000. This in turn would allow Sourcing to focus on strategic activities, which should increase productivity by the same 13.6 percent, resulting in an additional cost savings of $5.5 million.
In scope: PeopleSoft (supply chain management software) requisitions that are manually sourced to a PO by a buyer. The process begins when a requisition is submitted in PeopleSoft and ends when a PO is dispatched to a supplier.
Out of scope: Current catalog auto-sourced and interface POs.
Qualitative Analysis
In order to make the process efficient enough to either auto-source POs or transfer responsibility to the P2P team, it was necessary to review the as-is process map and determine which steps were non-value added. These steps couldn’t necessarily be immediately eliminated – it’s likely that a complete reconfiguration of the process would be needed. However, identifying the non-value added steps showed the team the complicated workflows that have high numbers of potential failure points and add additional stress to the outcome of the process. (See Figure 4.) The red process steps represented non-value added steps that do not contribute toward the completion of the activities. The yellow process steps represented value-enabled steps (steps that were added to satisfy stakeholder requirements). The green steps represented value-added steps (steps that contributed to the completion of the process).
The review revealed two key findings:
- 23 of the 43 steps were determined as non-value added steps.
- Fully one-half of the steps determined how to distribute requisitions to the correct buyer.

Measurement Plan
This measurement plan was originally sent out to determine the length of time taken for each PO. As the project proceeded in the Measure phase, the focus shifted from the time to complete the PO to the number of days it took before the PO was dispatched to the supplier.
The measurement plan included the total number of minutes spent processing purchase orders.
After the VOC survey it became clear that our internal clients were concerned with the length of time expressed as number of days as opposed to the number of minutes it took for an associate to produce a purchase order. It was also better data because we could precisely calculate the time the requisition was approved from the time the PO was dispatched thanks to the system’s time stamps.
In addition, when looking at the problems in the Define and Measure phases, it became clear that the actual time spent producing the PO was irrelevant because even if we were able to speed that up, it would still bottleneck at the distribution phase (from how the requisitions were assigned to each associate for processing into a PO). We couldn’t meet our clients’ requirements until the distribution was fixed.
Once the baseline data was collected, it became apparent the 40-step process was breaking down in the distribution of the requisitions to the buyers. While the mean number of days for 2015 and 2016 was relatively low (3 and 2, respectively), the standard deviation was another story. The standard deviation for 2015 was at 12 and 4.5 for the first part of 2016. This meant that the USL – upper specification limit, which was defined in this project as the number of days acceptable to issue a PO by our internal customers – was exceeded a whopping 47 percent (2015) and 33 percent (2016). Said another way, almost half of the POs that were being issued went beyond the five-day acceptable service level set by the internal customers (Figure 5).

Once the numbers provided insight to the significance of the problem, a fishbone diagram was created (Figure6) after a brainstorming session to highlight potential areas to test. The circled items represent areas the team wanted to test to determine how likely each issue was to affect the overall cycle time of the PO process.
