A Lean Six Sigma (LSS) team at a major insurance company was analyzing how to speed up death benefit payments to beneficiaries. It was taking several weeks and multiple phone calls to get the correct beneficiary forms executed and returned. Besides reducing cycle time to enhance customer satisfaction, the goal was to reduce follow-up labor cost by $30 per policy. Efforts were made to simplify the form and the cover letter. On a whim, one of the analysts called five beneficiaries to ask why customers seemed to be resisting the redemption process. The answer shocked him. The customers uniformly said, “I’m just going to take the money and reinvest it – can’t I leave it with your company?” The revenue implications to the company of changing the form to allow the beneficiary to reinvest the money rather than paying it out was more than $2,000 per annum per customer.
In the organizations where I have assessed service, quality and voice of the customer (VOC) processes, I have observed an almost universal focus on cost savings. The argument is that only cost savings are tangible and measurable. The problem is, like the example above, the cost savings are chump change when compared to the revenue implications of delivering an enhanced customer experience (CE). The good news is that CFOs accept business cases that carefully quantify the payoff of an enhanced CE.
5 Components for Business Case
The key to winning additional investment in quality is a business case based on enhancing the CE. The business case should include four components in addition to traditional cost savings. Often, the first three components below will produce more than 10 times the financial payoff of the cost savings noted in the fifth item. (In regulated companies, the fourth item, risk reduction, is also important.)
| Benefits Beyond Cost Savings | |||
| Financial Component | Parameters | Metrics | Size of Opportunity |
| Enhanced revenue | VOC | Enhanced loyalty | Very large |
| Enhanced margin | Profit margin | Sensitivity to price | Large |
| Enhanced word of mouth (WOM) | Importance of WOM in gaining new customers | Customers acquired by WOM | Medium |
| Reduced risk | Preventable legal and regulatory expenses | Claims, lawsuits and regulatory action costs | Large |
| Cost of handling issue/service efficiency | Savings on current service costs | Reduced service and warranty costs | Small to medium |
Quantify Each Component
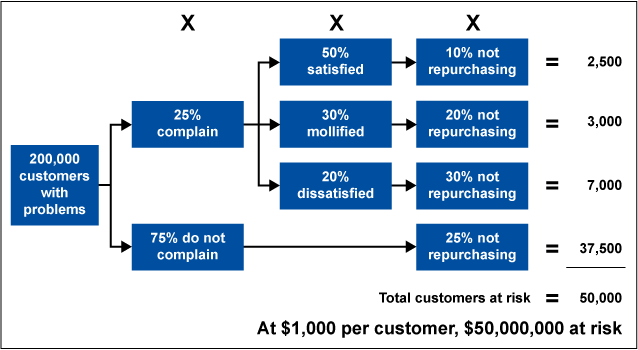
A business should quantify the revenue impact of reduced problems. For each quality issue, estimate how many customers have encountered the issue, how many have requested assistance and how many were satisfied or left dissatisfied and at risk for each outcome. The analysis can be portrayed as in Figure 1 below.

Figure 1 illustrates how to estimate the revenue left on the table by less-than-perfect quality and service. In this example where 200,000 customers encounter problems, an average of 25 percent will contact someone for assistance.
- Of those who request assistance, only 50 percent are completely satisfied (top box).
- Those who are not completely satisfied can be mollified – or be somewhat happy (e.g., the company apologized but could not fully recover).
- Or the customer may be completely dissatisfied.
Those customers who do not ask for assistance also have a significant 25 percent drop in loyalty – putting 37,500 customers at risk. At $10 per call to handle the complaint, the service cost would be $10 X 50,000 customers = $500,000. The revenue damage of the total number of problems in the marketplace is $50 million. The revenue implications are 100 times the cost implications.
Quantifying the WOM Effect of Problems
Great WOM is the cheapest source of new customers – existing customers do the company’s marketing. On the other hand, a 2017 rage study showed that if customers are left dissatisfied, they create three times as much negative WOM, telling, on average, 18 people bad things about your company versus six if the outcome is positive.1
The first step is to ask your chief marketing officer (CMO) three questions.
- What percentage of new customers come from personal referrals?
- How much does it cost to win a new customer via the traditional sales process?
- Would investment in an enhanced customer experience foster positive WOM that could more cheaply generate new customers?
For the first question, the numbers range from 20 percent up to 75 percent in consumer goods companies.
- At Chick-fil-A, their CE describes how new customers are pulled in by existing customers saying, “You have to try this!”
- The president of The Cheesecake Factory suggested that his company’s marketing expenses are less than 20 percent of the industry average due to great WOM.2
- In B2B technical services companies, WOM referral is the source of 70 percent to 90 percent of new customers.
When comparing the number of customers lost by a particular problem to the marketing cost of replacing them, it is frequently cheaper to prevent the problem from the start. Most CMOs will immediately see the payoff of avoiding negative WOM and capitalizing on more positive WOM. All you need to do is ask the questions and assist in identifying the percentage of customers acquired via WOM referrals.
Problem Prevention Leads to Higher Margins
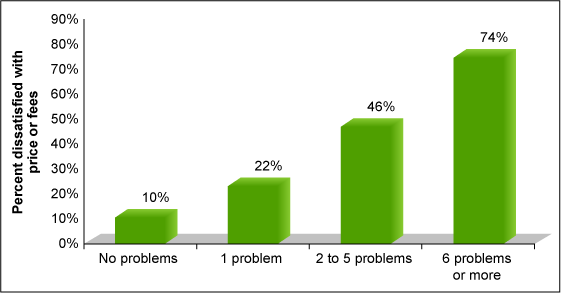
Across a wide range of industries, one problem doubles dissatisfaction with price and two problems doubles it again. A company can quantify this in its marketplace by asking a random sample of customers three simple questions:
- Have you had any recent problems?
- If yes, how many?
- What is your satisfaction with prices and fees?
The resulting compelling information, like the data in Figure 2 below from a financial services firm, should convince company leadership to accept an investment in quality.

By eliminating the primary problem customers’ encounter, the company can safely charge a premium price versus an average price. In examining pricing – even in relatively commoditized markets – this increase in profitability is at least 2 percent to 3 percent, and can be significantly higher. One technology company reported that its product quality allows them to achieve more than twice the margin of their closest competitor. Marketing and finance will find this strategy both attractive and possible to quantify.
Increased Prevention of Problems Can Reduce Risk and Legal Cost by 10 Percent or More
The majority of risk issues are first reported to the company as complaints and problems, with customers only talking to a lawyer or regulator after they have been rebuffed by the company. A company can quantify the sources of its legal and regulatory costs.
If the problem is prevented, risk evaporates. After spending $100 million complying with an FDA warning letter, one pharmaceuticals company happily invested an additional $5 million per year in quality and consumer affairs to both prevent problems and assure that any existing problems are handled before the customer goes to a lawyer or regulator, thereby reducing the risk of receiving another warning letter. The general counsel stated, “We view the investment in quality and service as an insurance policy against another regulatory disaster.”
Preventing Unpleasant Surprises Reduces Service Workload
If a company’s VOC process identifies the top five issues or unpleasant surprises that customers encounter, and the issues are eliminated or customers are warned how to avoid them, contacts about those issues (as well as dissatisfaction) decline dramatically. Such education is actually a delighter that raises loyalty while reducing problems.
For example, Jamon Horton, quality leader at Aflac Insurance, working with customer insights, identified that customers wanted an easier way to print their invoices. Aflac’s information technology (IT) department explained that customers already could – the link was four clicks in from the website home page. Horton suggested moving the link to the home page. Use of the link went from 30,000 customers per month to more than 100,000 customers per month. It is likely that many of the incremental 70,000 users had been previously calling their agent or Aflac, asking how to print their invoice.
An organization’s service and VOC process should not be shy about taking credit for the cost reductions. A good service system prevents unpleasant surprises and educates customers how to avoid them. For instance, the head of service at HP reported that every two minutes invested in proactive education on products and the support website returned ten minutes in reduced service expense.
Get Started
1. Ally LSS with customer insights to create a robust VOC.
Continuous improvement and customer insights together create a powerful team. A company can identify the top customer problems using its customer service team.
2. Determine a conservative value of the average customer.
Lifetime value should not be used by quality professionals, as most finance executives view long terms of loyalty as being too speculative. For example, a finance professional may think, “Who knows if we’ll even be in this business eight years from now?” Use one or two years of revenue as a conservative estimate.
3. Quantify the damage of different types of problems as well as the multiplier.
A company can determine which problems are doing damage to loyalty and work with customer insights to field a one-time survey to understand how many customers do not complain and what the revenue and WOM damage is for each type of problem. You will find that often only one out of 10 or 20 customers are complaining.
4. Pick one problem and quantify the five factors’ opportunity for a single month of inaction and create a quantifiable experiment, using either a pre/post analysis or an A/B test.
If a business quantifies the cost of inaction, action is precipitated. If an LSS team can say that over the next month, 10,000 customers will encounter this problem with 10 percent damage to loyalty (1,000 customers lost) and produce 50,000 cases of negative WOM, management will take action. The team can gain agreement on both the process and outcome metrics (via, for example, a short customer survey) that will be used to evaluate the impact.
Summary
LSS project selection criteria should focus more heavily on customer loyalty, WOM and sensitivity to price rather than cost savings. The payoffs and return on investment of customer experience enhancement will be dramatically higher than the cost savings achieved by traditional internal process improvement projects.
References
1. 2017 National Rage Study, Customer Care Measurement & Consulting. https://www.customercaremc.com/insights/2017-us-customer-rage-study/. Published September 2017. Accessed January 3, 2019.
2. Speech by Michael Jannini, president of The Cheesecake Factory at Arizona State University, Center for Service Leadership, WP Carey School of Business, November 2012.