Key Points
- A Thought Process Map is a great way of visualizing your projects.
- They utilize a comprehensive line of questioning to fully visualize your projects.
- Once completed they provide a framework and guide to completing your projects.
For a Six Sigma project to be successful, it must begin with a solid foundation. One tool that can ensure a firm foundation is the thought process map sometimes referred to as a TMAP or TPM.
A TMAP is a visual representation of a Black Belt, a team leader’s, or an entire team’s thoughts, ideas, and questions relative to accomplishing the project goal. It should be one of the first tools employed when starting any Six Sigma or process improvement project. A TMAP presents a structure of information and helps a team progress through the DMAIC process. It is a living document that will change throughout the project and has no set format. A TMAP can be used to drive specific actions and select the Six Sigma tools that should be employed.
A TMAP should include, but is not limited to:
- The project goal(s) or problem statement(s)
- Specific areas/parts of a process to be analyzed
- Any issues or questions to address
- What is known about those issues or questions
- What is not known about those issues or questions
- Initial assumptions about each issue or question.
- What data or information is needed
- Potential barriers to reaching the project goal
- Interconnections between each part/issue/question
- Potential Six Sigma tools to be used
When creating a TMAP, the only wrong piece of information is the one left out.
Why Should the TMAP Be Used?
The single, most important benefit of using a TMAP early in a project is it ensures that nothing is left out or missed. It is an effective tool for ensuring all potential questions and issues of a project have been identified and addressed from the beginning of a project to completion.
It also provides an effective way to brainstorm, take notes, gather and view information, and even summarize data. It reminds the team what assumptions were made, the actions that followed, and the latest status of the project. It is an effective way of communicating, as well as consolidating information from a single person or among various teams.
Finally, it provides a visual map that tracks the development of ideas and issues, as well as the extent of questioning. Like all maps, it shows where the team or individual has been, where they are at, and where they need to go in pursuit of resolution to particular issues.
Why It Matters
So, why should you consider using a thought process map? There are plenty of tools at your disposal when utilizing Six Sigma. However, a thought process map is a great means of providing a framework for constructing a process or project. As you’re identifying core elements, you’re taking a closer look at what is needed to construct one.
How to Create a Thought Process Map
There are various ways to create a TMAP, but the easiest and most effective way is following these five steps.
- Define the project goal(s)
- List the knowns and unknowns
- Ask DMAIC (Define, Measure, Analyze, Improve, Control) questions and “grouped” questions
- Sequence and link the questions
- Identify possible tools to be used
Before Making a TMAP
In preparation for making a thought process map, here are a few recommendations:
- Use large (about 2×2.5-foot) easel pads or poster board. This allows information to be viewed easily.
- Use different colored markers – allowing different colors for knowns, unknowns, questions, etc.
- Use Post-its – these will allow information to be grouped/moved around the map more easily.
- Involve the entire team – the more input the better and do not exclude anyone or any information.
- Do not critique – just gather as much information as possible and filter it later.
- Do not make initial (i.e., false) assumptions. If the data is unknown, list it as so and research it later.
Here then, is how these five steps can be used to create a TMAP.
Step 1: Define the Project Goal(s)
First and foremost, a team needs to clearly define the goal. What is the team trying to accomplish? Is it a problem that needs to be solved? Is it a potential opportunity for growth that needs to be explored? By defining the goal, the team also will define the project scope. This is essential to do early on in a project.
Referencing the project charter (the document that formally recognizes a Six Sigma project, identifies the scope, and includes a problem statement, objective, benefits, team members, process owner, and Champion) is very helpful in this step, as it should contain the goal or problem statement of the project.
At this point, someone on the team writes the goal or problem statement at the top of a large poster board or easel pad. And the TMAP has begun. The other four steps will be put on the board or pad below the initial statement. For this example, a generic problem can be used to clearly illustrate all the steps. Here is a common problem encountered in the manufacturing world:
“The receipt and processing of delivered materials takes too much time.”
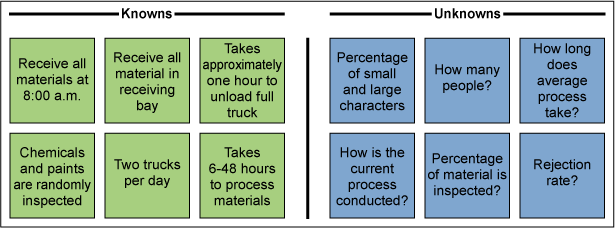
Step 2: List the Knowns and Unknowns
For this step, it is most helpful to simply create two columns – one for what the team knows and one for what the team does not know. It might be surprising how much information is known, but even more surprising how much the team does not know.
Information can include but is not limited to metrics, times, costs, issues, potential barriers, points of contact, current problems, customer requirements, outputs, inputs, process steps, quantities, and locations.
Knowing pertinent information and data in the initial stages is important; however, equally important is realizing what data the team will need to research.
So, as the building of the TMAP continues, two columns are created off to the side (Figure 1). The items in each column – knowns and unknowns – are written on sticky paper.
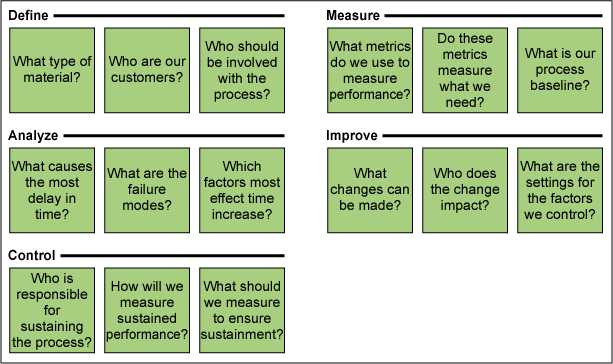
Step 3: Ask DMAIC Questions and ‘Grouped’ Questions
This step coincides closely with the previous step. Team members will recognize that their unknowns (from Step 2) and questions from this step are very similar. The main difference is the approach. Using two separate approaches allows very different pieces of information and questions to surface. In the previous step, the team is stating inquiries from the perspective that they simply do not know a vital piece of information. In this step, they are asking questions from both the DMAIC approach, as well as a grouped approach.
First, ask questions from the categorical perspectives of DMAIC: Define, Measure, Analyze, Improve, and Control. These will be the five areas into which all questions will be categorized. It is important to ask as many questions as possible – this is a brainstorming exercise and no question is a bad question.
So, again using sticky paper, some common questions are shown in Figure 2.
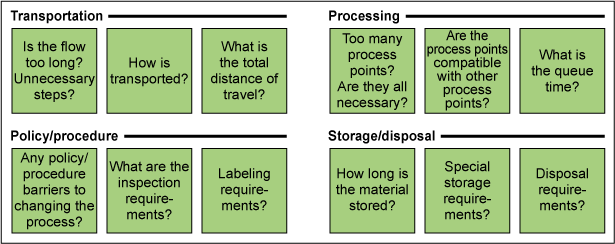
Next, the team needs to ask questions from the perspective of groups that are within or affect the process (Figure 3).
Step 4: Sequence and Link the Questions
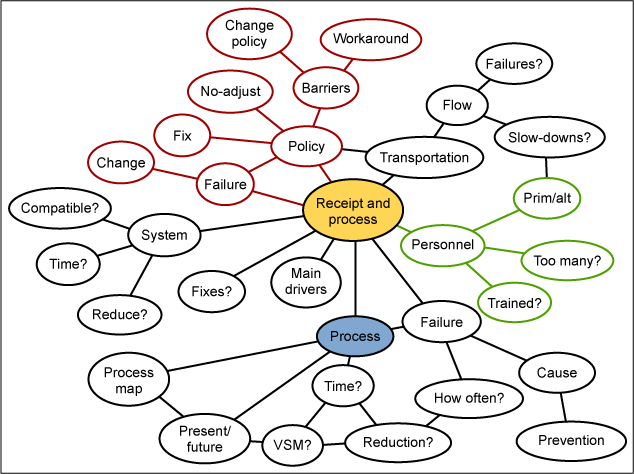
Now it all comes together. Sequence questions below the problem statement (or goal) and flow them down. Additionally, link questions that are related to each other. The team members will find in this step that they will generate many additional questions. An example of a basic TMAP may look like the illustration in Figure 4.
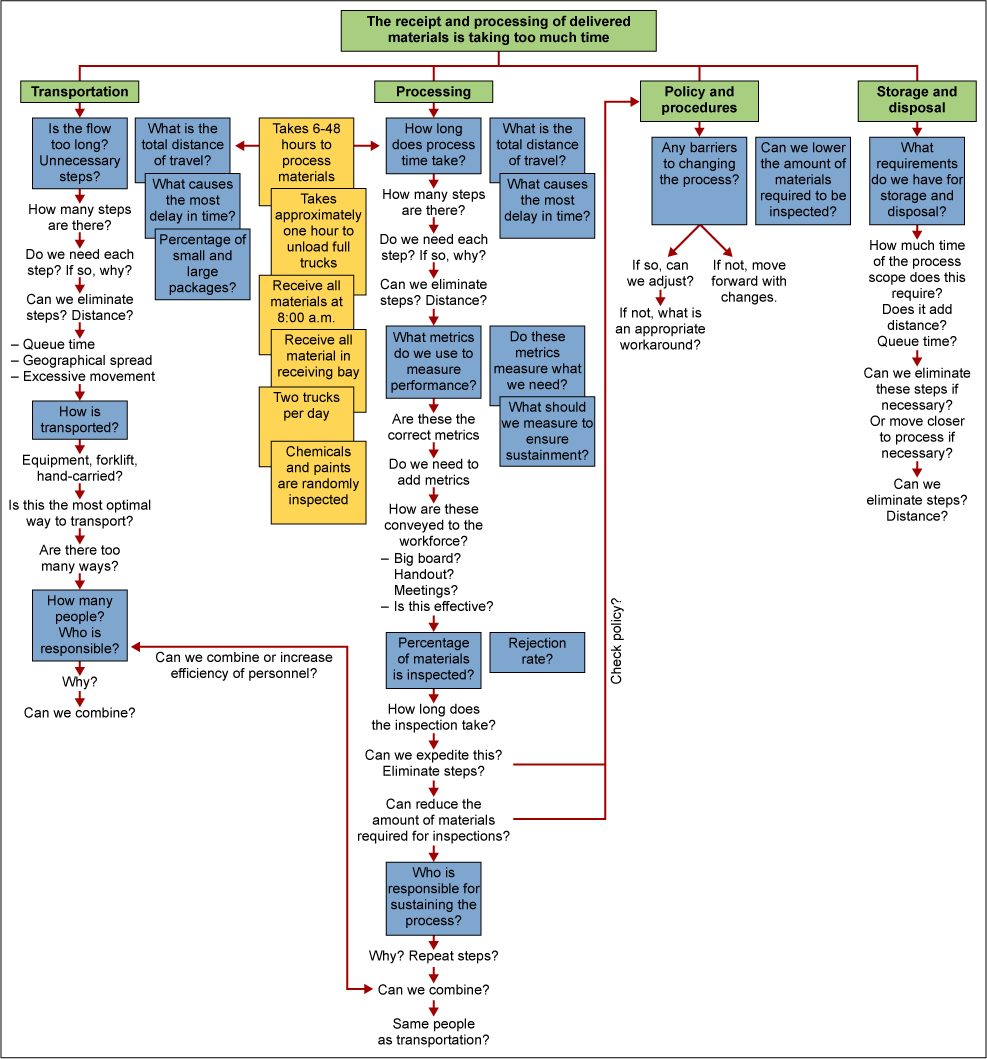
This TMAP is a fairly simple example. Many questions, subgroups, and links could yet be added. The complexity of any TMAP is dependent upon the complexity of the process, as well as the depth of the project team’s analysis.
Step 5: Identify Possible Tools to Be Used
Finally, the project team should identify the potential Six Sigma tools to be used to answer the questions posed. The most effective way to perform this step is to create a four-column matrix, as illustrated in the table below. It should have a column for the question, the tool or method, who is responsible, and the due date.
| Matrix for Identify Potential Six Sigma Tools/Methods | |||
|
Question |
Tool/Method |
Person Responsible |
Due Date |
| How long and how many people does the transportation steps take? |
Value stream map | ||
| How long and how many people does the process steps take? |
Value stream map | ||
| Where are our failure modes? |
Failure mode and effects analysis (FMEA) | ||
| How is the material inspected? |
MSE | ||
| Percentage of small packages versus large packages? |
Data analysis | ||
And with this table, the TMAP process is complete, and the Six Sigma project is off to a strong start.
Other Useful Tools and Concepts
If you’re looking to increase your chances of success, then you’re in luck. Learning how to plan for your efforts can seem daunting. However, our guide focusing on the six steps you can take will have you on the right track in no time.
Further, learning how to keep your Lean program on track isn’t as hard as it might seem. Our article covers what you need to know when it comes to handling your Lean programs, and why listening to your employees is going to pay dividends in the long run.
Another Interesting Form for a TMAP
Another common format for a TMAP is using a bubble diagram as illustrated in Figure 5. This format often works better for processes that have many links. The five-step process can still be used to create it. Format is not significant as long as the TMAP helps the team in achieving its objective of a successful Six Sigma project.