
Integrating Design for Six Sigma (DFSS), IDOV (identify, design, optimize, validate) roadmap and selected DFSS tools in the information technology (IT) system development methodology can strengthen the business focus of IT system delivery. Adding additional steps at the beginning and end of the traditional system development cycle for DFSS can support the better understanding of the business process and the customer requirements involved, and allow the organization to realize proven business results as well as continuously monitor process metrics.
A pharmaceutical company, Medistar, applied DFSS tools to develop a new pharmacovigilance system (captures and analyzes observed drug side effects) in association with the launch of a new drug. Such a system is necessary since after its market launch a drug is exposed to a much larger population than in the clinical studies conducted during the drug development. This can lead to a change in the known safety profile of a drug. Medistar recognized the need for an updated system using newer technology. Under the old system a physician manually completed a registration form and mailed it to the respective field service agent who then transferred the information manually into yet another system. The information regarding the adverse effect was then forwarded to the pharmacovigilance team. This process was slow, cumbersome and could take several days – too long given the potential consequences of an unidentified risk.
With the launch of the new drug Medistar wanted to play it safe – every side effect should be immediately identified and addressed. From capturing all relevant patient data to the medical director making a decision, all major process steps and influence factors were in the process-scope of the project.
The Identify Phase
At the beginning of the identify phase the project sponsor, the medical director of Medistar and the project manager agreed on a team with representatives from the IT department and pharmacovigilance organization. One of the team’s first tasks was to identify the system needs and what business processes it needed to address. The goal was to understand the process, its internal and external customers and their requirements before developing the system. Therefore, the team developed a high-level process map using SIPOC (suppliers, inputs, process, output, customers). The developers of the SIPOC map recognized that not every adverse event would necessarily entail a counter measure.
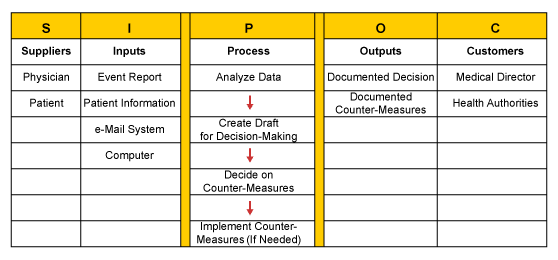
The next step was comprehensive voice of the customer (VOC) data collection. The team interviewed representatives from the pharmacovigilance teams, the medical director and the chief executive officer of the company. Most of the customers immediately referred to IT software requirements instead of expressing their needs and expectations with regards to the business processes lying behind the system. Only by repeatedly challenging the answers were the customers’ true process related needs identified. The team translated those requirements into measurable CTQs (critical to quality), which served as the basis for defining key performance indicators (KPIs) for the new pharmacovigilance process.
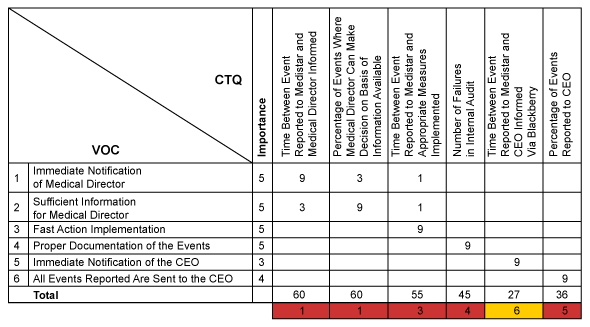
The translation of customer needs into CTQs and their prioritization was done using quality function deployment (QFD). Accordingly, the two main CTQs of the “should-be” process were the time between a side effect (or event) reported to Medistar and notification of the medical director, and the frequency with which the medical director could make a decision based on this information.
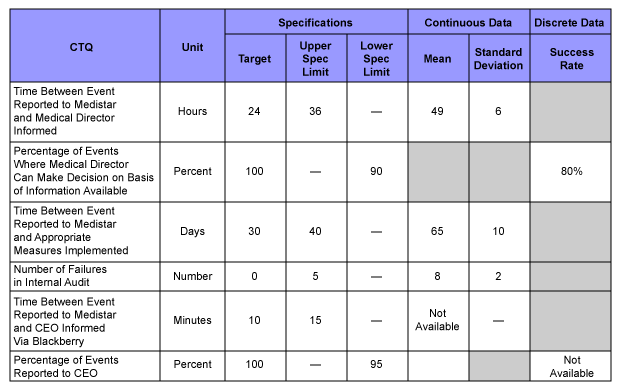
All CTQs were summarized with target values and tolerances in a design scorecard. This was used throughout the project to measure and document the system performance. Since the company already had a pharmacovigilance system in place (with reduced functionality), as-is performance data for the first four CTQs were collected and included in the scorecard.
The Design Phase
At the beginning of the design phase, the team created a detailed process of the should-be process. This showed detailed process steps and responsibilities as well as first requirements with regards to the new pharmacovigilance system.
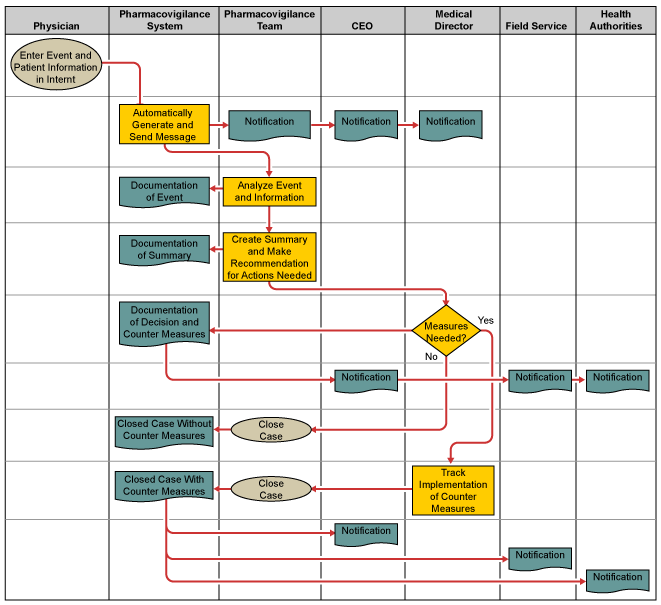
Using this map the team started defining the user requirement specifications (URS) for the system. In a workshop with previously interviewed customers URS were identified and – in order to ensure that all previously identified CTQs were considered – a QFD 2 matrix was used to map and prioritize the URS against the CTQs. The main priorities from a user perspective were a user-friendly input mask and the ability to automatically create summaries and detailed reports.
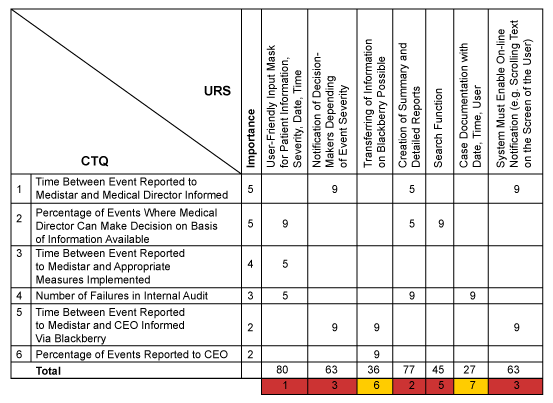
In addition to the above requirements other technical, system and data requirements were defined. For example, the system should include a security system with user access, including permanent access to all information for the health authorities and other specific standards imposed by the company.
On the basis of this information an initial conceptual design of the new pharmacovigilance system was developed, and it was revealed that an off-the-shelf solution was not available. An existing software system, however, could be customized to meet the needs.
Another important step in the design phase was the development of functional specifications in accordance to the previously described system requirements. The team opted for the application of QFD 3, as this could guarantee traceability of the requirements. The team began to define service level requirements for the future maintenance and support organization of the pharmacovigilance system.
The Optimize Phase
The optimize phase was typical for a software development project. It included a detailed adaptation of the software according to the customer needs and the establishment of necessary testing and validation procedures. For the description of test cases the previously created QFD 3 was helpful and provided an overview of system requirements and functional specifications.
The Verify Phase
The added value of DFSS tools in the last phase of software development was to ensure the effective handover of the IT system to the process owner – the head of the pharmacovigilance team.
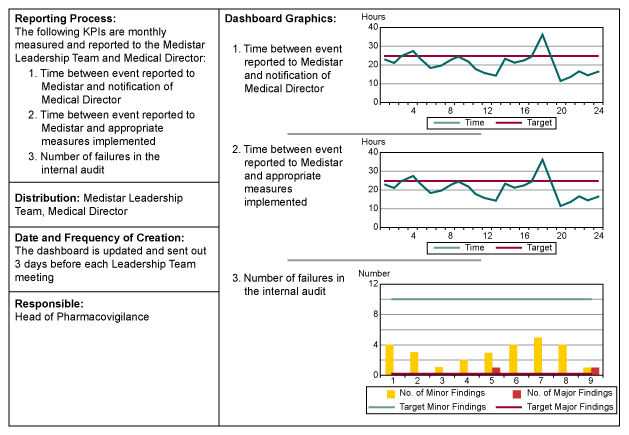
In coordination with the team leader, the project team developed a dashboard to monitor the process performance. Based on previously defined CTQs key performance indicators (KPIs) were defined – how often they had to be calculated, by whom, and to whom they had to be reported.
Graphic 6 provides an overview of the different aspects of the dashboards.
During the verify phase the users were trained on the new system and the old pharmacovigilance system was shutdown. The transition from the old system to the new went well and was in place prior to Medistar launching the new drug.
Conclusion
After only two months, the head of pharmacovigilance proudly presented new data that reflected that not only had no major events regarding the new drug been reported, but that the process and the IT system also functioned as desired.