When utilizing a team approach to problem-solving, there are often many opinions as to the problem’s root cause. One way to capture these different ideas and stimulate the team’s brainstorming on root causes is the cause and effect diagram, commonly called a fishbone.
The fishbone will help to visually display the many potential causes for a specific problem or effect. It is particularly useful in a group setting and for situations in which little quantitative data is available for analysis.
Finding the Root Cause
The cause-and-effect diagram is a useful tool due to its simplicity. You aren’t sitting down to create some detail-oriented visualization of your current issue. Instead, where the fishbone diagram truly shines is letting the end user see all pertinent information at a glance.
Further, they’re simple to create, relying more on a set of simple questions than any in-depth analytical tool or process to get started.
Constructing a Cause-and-Effect Diagram
The fishbone has an ancillary benefit as well. Because people by nature often like to get right to determining what to do about a problem, this can help bring out a more thorough exploration of the issues behind the problem – which will lead to a more robust solution.
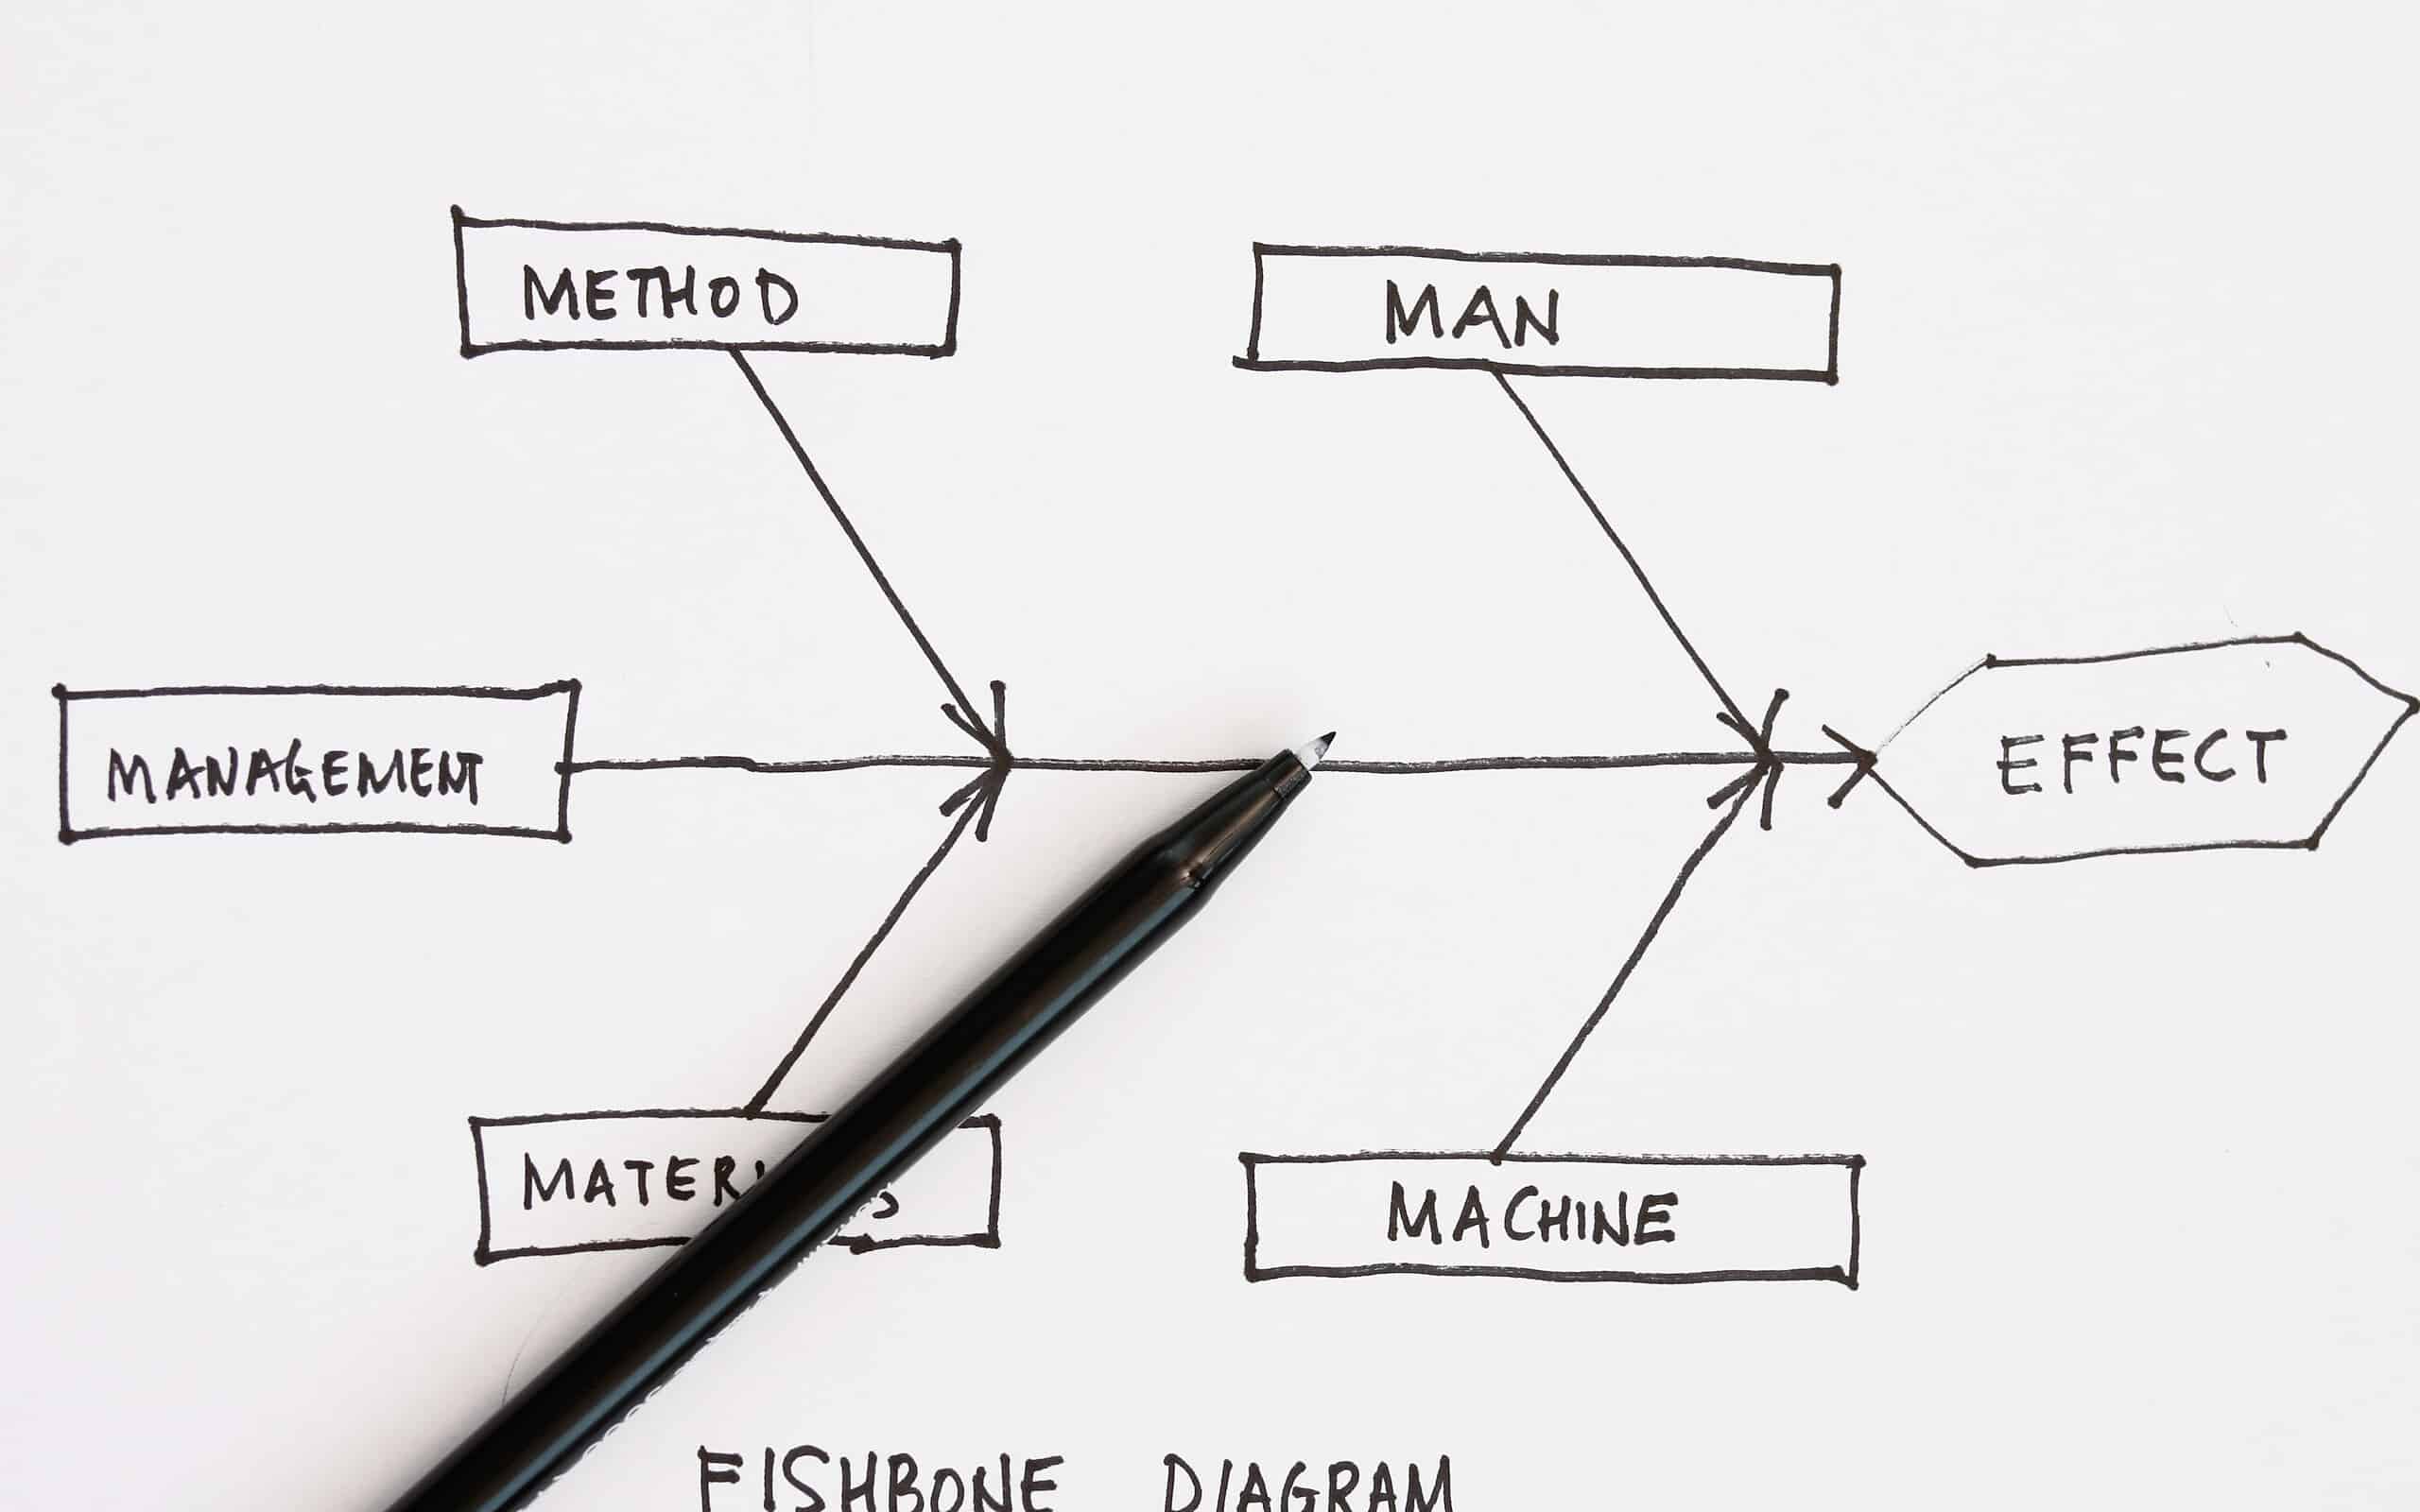
To construct a fishbone, start by stating the problem in the form of a question, such as “Why is the help desk’s abandonment rate so high?” Framing it as a “why” question will help in brainstorming, as each root cause idea should answer the question. The team should agree on the statement of the problem and then place this question in a box at the “head” of the fishbone.
The rest of the fishbone then consists of one line drawn across the page, attached to the problem statement, and several lines, or “bones,” coming out vertically from the main line. These branches are labeled with different categories. The categories you use are up to you to decide. There are a few standard choices:
Table 1: Fishbone Suggested Categories
| Service Industries (The 4 Ps) | Manufacturing Industries (The 6 Ms) | Process Steps (for example) |
|
|
|
You should feel free to modify the categories for your project and subject matter.
Adding Detail
Once you have the branches labeled, begin brainstorming possible causes and attach them to the appropriate branches. For each cause identified, continue to ask “Why does that happen?” and attach that information as another bone of the category branch. This will help get you to the true drivers of a problem.

Once you have the fishbone completed, you are well on your way to understanding the root causes of your problem. It would be advisable to have your team prioritize the key causes identified on the fishbone somehow. You may also want to validate these prioritized few causes with a larger audience if necessary.
Other Useful Tools and Concepts
Looking for some other useful tools for your business? Well, you’ve certainly found the right place. Causal loop diagrams can be used right alongside something like a cause-and-effect diagram to pinpoint issues. These visual tools analyze every relationship between variables and elements in a process to find what’s happening throughout.
Additionally, learning how to integrate the 5 Whys is a great way to bolster the effectiveness of your cause-and-effect diagrams. This simple set of questions is a great way of looking at a problem and drilling down to the actual cause of it. Best of all, you don’t need a computer to do it, just a pad of paper and an analytical mindset.