
Hypothesis testing is a branch of statistics in which an inference is made about a population parameter or a population probability distribution using data from a sample.
Let’s examine the purpose of hypothesis testing, the underlying statistical concepts, the importance of using hypothesis testing, and some best practices for optimizing the technique’s value.
Overview: What Is Hypothesis Testing?
Hypothesis testing in statistics is a way for you to test the results of an experiment to see if you have meaningful results. The outcome of your hypothesis test will tell you whether your results are caused by pure chance or not. If your results are due to pure chance, then you will have a difficult time replicating or repeating them. But, if your results were due to something significant happening, you can use that knowledge to repeat the results.
Hypothesis testing applies to all forms of statistical inquiry. For example, it can be used to determine whether there are differences between population parameters or to gain an understanding of slopes of regression lines or equality of probability distributions.
The Process for Completing a Hypothesis Test
First, a hypothesis statement and assumption are made about the population parameter or probability distribution. This initial statement is called the null hypothesis and is denoted by Ho. An alternative or alternate hypothesis (denoted with Ha), is then stated, which will be the opposite of the null hypothesis.
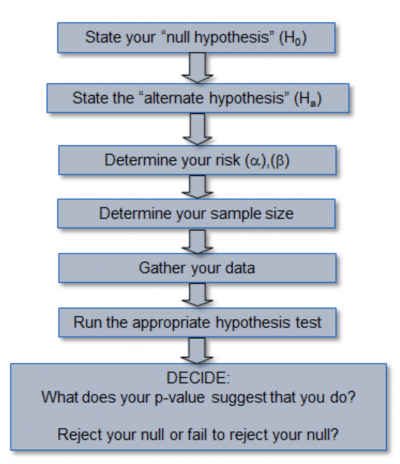
The hypothesis testing process and analysis involve using sample data to determine whether or not you can be statistically confident that you can reject the Ho. If the Ho is rejected, the statistical conclusion is that the alternative or alternate hypothesis Ha is true.
Since you’re using sample data to make your inferences about the population, there’s a risk that you’ll make an error. You can choose the level of risk you’re willing to accept for this error. In the case of the null hypothesis, we can make one of two errors.
- Type 1, or alpha error: An alpha error is when you mistakenly reject the null hypothesis and believe that something significant happened when it did not. In other words, you might believe that the means of the two populations are different when they aren’t. You can pick your risk of being wrong to be 1%, 5%, 10%, or any other reasonable value.
- Type 2, or beta error: A beta error is when you fail to reject the null when you should have. In this case, you missed something significant and failed to take action. This risk typically runs in the range of 80% to 90%, or again, any other reasonable value.
The next step would be to determine the appropriate sample size you would need to be able to rely on the statistical validity of your results. Then, go out and collect your data.
Next Steps Forward
You will then need to decide what the appropriate statistical test for the type of data and hypothesis you’re testing is. Using a statistical software package, you’ll get a multitude of numerical results. One you can focus on is something called the p-value. The p-value is your calculated risk of making an alpha error or claiming success when there wasn’t any. You will likely require the advice and guidance from a Lean Six Sigma Black Belt or Master Black Belt to sort all of this out.
Finally, you’ll need to decide whether or not to reject the null hypothesis. Your decision is made by comparing the alpha value (your assumed risk) with the p-value (actual risk). If the actual risk is lower than your assumed risk, you can feel comfortable in rejecting the null hypothesis and claiming something has happened. But if the actual risk is higher than your assumed risk, you will be taking a bigger risk than you want by rejecting the null.
3 Benefits of Hypothesis Testing
Hypothesis testing is a statistical technique for making decisions about whether the changes in your process are a result of chance or a result of some improvements you made. Here’s why you want to use hypothesis testing.
Statistical Assurance of Determining Differences Between Population Parameters
Just looking at the mathematical difference between the means of two samples and making a decision is woefully inadequate. By statistically testing the null hypothesis, you will have more confidence in any inferences you want to make about populations based on your samples.
Statistically-Based Estimation of the Probability of a Population Distribution
Many statistical tests require assumptions of specific distributions. Many of these tests assume that the population follows the normal distribution. If it doesn’t, the test may be invalid.
Assess the Strength of Your Conclusions As to What To Do With the Null Hypothesis
Hypothesis testing calculations will provide some relative strength to your decisions as to whether you reject or fail to reject the null hypothesis.
Why Is Hypothesis Testing Important To Understand?
The interpretation of the statistics relative to the null hypothesis is what’s important.
Properly Write the Null Hypothesis To Capture What You Are Seeking To Prove
The null is always written in the same format. That is, the lack of difference or some other condition. The alternative hypothesis can be written in three formats depending on what you want to prove.
Frame Your Statement and Select an Appropriate Alpha Risk
You don’t want to place too big of a hurdle or burden on your decision-making relative to action on the null hypothesis by selecting an alpha value that is too high or too low.
There Are Decision Errors When Deciding on How To Respond to the Null Hypothesis
Since your decision relative to rejecting or not rejecting the null is based on statistical calculations, it’s important to understand how that decision works.
An Industry Example of Using Hypothesis Testing
The new director of marketing just completed the rollout of a new marketing campaign targeting the Hispanic market. Early indications showed that the campaign was successful in increasing sales in the Hispanic market.
He came to that conclusion by comparing a sample of sales before the campaign and current sales after implementation of the campaign. He was anxious to proudly tell his boss how successful the campaign was. But, he decided to first check with his Lean Six Sigma Black Belt to see whether she agreed with his conclusion.
The Black Belt first asked the director his tolerance for the risk of being wrong by telling the boss the campaign was successful when, in fact, it wasn’t. That was the alpha value. The Director picked 5% since he was new and didn’t want to make a false claim so early in his career. He also picked 20% as his beta value.
When the Black Belt was done analyzing the data, she found out that the p-value was 15%. That meant if the director told the VP the campaign worked, there was a 15% chance he would be wrong and that the campaign probably needed some revising. Since he was only willing to be wrong 5% of the time, the decision was to not reject the null since his 5% assumed risk was less than the 15% actual risk.
3 Best Practices When Thinking About Hypothesis Testing
Using hypothesis testing to help make better data-driven decisions requires that you properly adhere to the testing procedure.
Always Use the Proper Nomenclature When Stating the Null and Alternative Hypotheses
The null will always be in the form of decisions regarding the population, not the sample. For example, the null and alternate hypotheses for testing the difference between two means are written as:
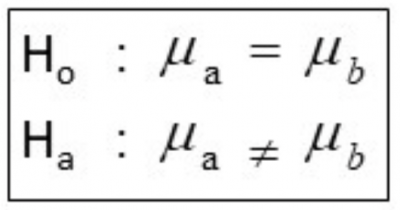
Note that you use mu (population average) as the nomenclature for the mean, not Xbar (sample average). You are not interested in whether the sample means are different since you already have those calculations. You are interested in if the means of the two populations the samples came from are different.
Select an Appropriate Sample Size
The statistics and final results will depend on you determining the appropriate sample size and then appropriately collecting the data. Use statistics to determine the sample size, not intuition.
Pick a Reasonable Alpha Risk So You’re Not Always Failing To Reject the Null Hypothesis
Being too cautious will lead you to make beta errors, and you’ll never learn anything about your population data.
Summing Up Hypothesis Testing
Hypothesis testing is a powerful statistical technique for confirming whether something is as you believe it is. You first state your basic or null hypothesis, followed by your alternative one. You decide on the risk you are willing to take of being wrong. Collect your data and use the appropriate statistical test based on your statistical question and type of data. Interpret your results and conclude as to whether your null hypothesis was correct or not.