
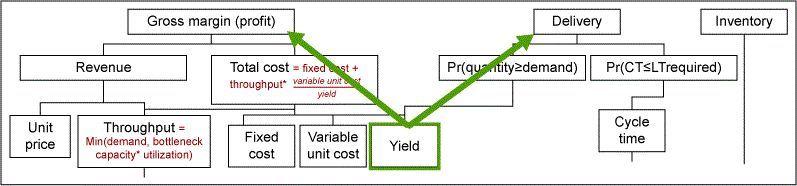
Yield is a key parameter in most manufacturing processes – tied to financial results, delivery and quality as shown in Figure 1.
Yield modeling allows the team to predict future yield and prioritize opportunities to improve yield. A yield model combines predicted yields for each step of the process into a predicted yield distribution for the entire manufacturing or assembly process.
Single-use reliability or mission reliability is analogous to yield modeling and refers to the overall probability of success, such as the success of a military mission, the launch of a satellite, or the probability of success for a medical procedure. The overall probability of success for the mission or procedure is a combination of the probabilities of success for each step in the mission or procedure, similar to steps in a manufacturing process.
By using either – or both – of these models, you can better prioritize your processes for improvement.
The probability of success for each step of a process, procedure or mission can range between 0 percent to 100 percent, so it can be modeled using a statistical distribution that ranges between 0 percent and 100 percent, such as a beta distribution. The overall probability for success of the process, mission or procedure also can range between 0 percent and 100 percent, and can likewise be represented by a beta distribution. Fortunately, combining the probabilities of success for each step by multiplying beta distributions for each step results in another beta distribution representing the probability of success for the mission, procedure or process.
Beta Distributions
Beta distributions, initially referred to as Pearson type 1 distributions, represent the family of distributions bounded by 0 percent and 100 percent. The beta distribution has two parameters, often referred to as alpha and beta. Insight into the meaning of alpha and beta parameters can be provided by analogy to the Bernoulli and the binomial discrete distributions.
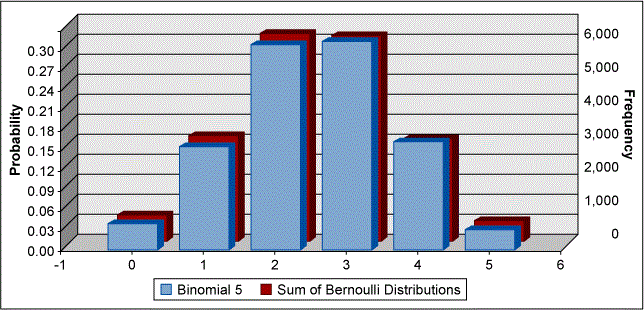
On an individual basis, a part can pass or fail or a step in the process can experience success or failure; this can be represented by the Bernoulli distribution. If there is a set of five parts or five iterations of the process step, this can be represented by the counts of successes among five Bernoulli distributions; the distribution of the numbers of successes among the five Bernoulli distributions will give the same result as a binomial distribution for the counts of the number of successes among a set of five trials. Figure 2 shows the overlay of binomial distribution with probability of success per trial of 50 percent and five trials, compared to the sum of five Bernoulli distribution results each with a probability of success per trial of 50 percent.
If the number of trials is much larger than five, the information will move from discrete counts of successes divided by total attempts and approach a continuous parameter, the probability of success.
Binomial and Beta Probability Equations
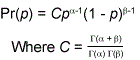
By analogy to the related binomial distribution, two parameters of the beta distribution, alpha and beta, reflect the expected number of good parts and bad parts, respectively. The equations of binomial and beta probabilities are as follows.
Binomial probability:
![]()
Where s is the number of successes in n trials
Equation 1
Beta probability:
Equation 2
So, if a step in the process has been tried n number of times, and has succeeded s times and failed f = n – s times, the probability of success can be estimated by a beta distribution with an alpha parameter of (s + 1) and a beta parameter of (f + 1), described as beta(s + 1, f + 1). This approach provides a useful way to model the probability of success for an individual step in a manufacturing process or mission or procedure using beta distributions.
If the success of a step in the process is based on a continuous parameter rather than a discrete pass/fail parameter, the probability of success can also be converted to a beta distribution. A measure of goodness for the continuous, such as Cpk, z-score or yield can be used to estimate the probability of passing, p. However, estimating the two parameters for a beta distribution require two values, and the probability of passing, p, must be supplemented by a second value.
This second value can be the number of samples, n, or a value for n can be assumed to reflect the degree of uncertainty in the Cpk, z-score or yield from the parameter distribution. Using the previously referenced analogy between the beta and binomial distributions, the variance of yield or single use reliability is variance = p(1 – p)/n. Values for alpha and beta can be estimated from these equations based on the beta-binomial distribution analogy shown in Equations 3 and 4.
Alpha ≈ (p2-p3)/Variance – p
Equation 3
Beta ≈ alpha*(1 – p)/p
Equation 4
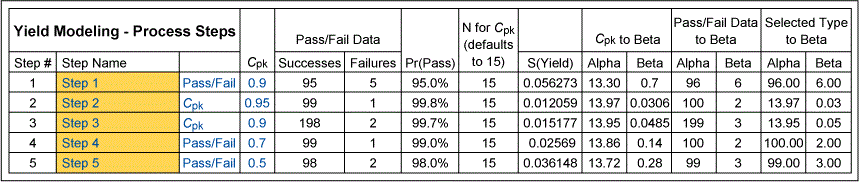
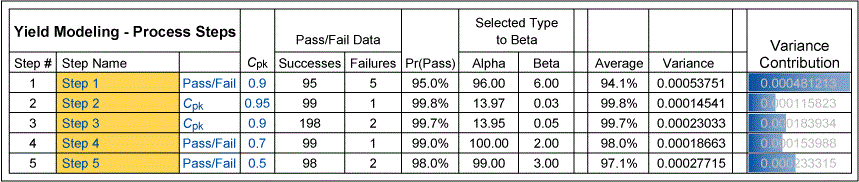
Values for the alpha and beta for the probability of success can be estimated for each step – whether based on the actual or predicted numbers of passes and fails for a discrete parameter or the Cpk or z-score or yield for a continuous parameter. An example of this summary is shown in the table below of yield modeling for five process steps, some continuous (Cpk) and some discrete (pass/fail).
These values of alpha and beta for each step can be combined into overall probability of success for the overall process, corresponding to the overall yield for a manufacturing process or the probability of success for a procedure or mission, as shown in Figure 3. You can combine the values to use Monte Carlo simulation or another method based on the generation of system moments method. Both methods can provide sensitivity analysis that can help in prioritizing opportunities to improve yield or reliability, as shown in Table 2.
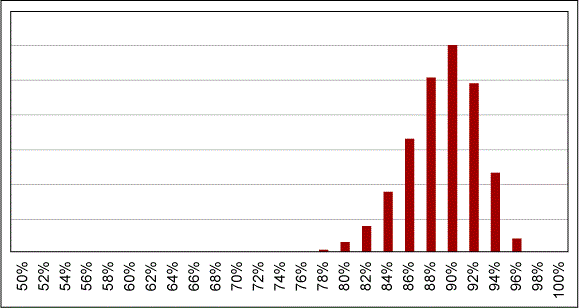
Since the combined distribution is represented by a beta distribution, a lower confidence limit for yield or single-use reliability can be established, as shown in Table 3.
| Table 3: Yield or Single Use Reliability at 95% Confidence Using the Cumulative Beta Distribution Function | |
| LSL confidence interval | 95% |
| Yield at 0.95 confidence | 82.9% |
Summary
Yield and single-use or mission reliability can be modeled by breaking the process or procedure into individual steps, representing the probability of success at each step as a beta distribution, and combining these beta distributions into an overall yield or reliability probability distribution. This approach allows the team to predict yield or reliability and to prioritize opportunities for improvement.