
You often want to determine whether there is a difference in means between one, two or more groups of sample data. Likewise, you will also want to know about the variances between those groups. Let’s see how you can use the F test to do that.
Overview: What is the F test?
The F Test is a generic term for any test that uses the F-distribution. Typically you hear about the F-Test in the context of comparing variances, Analysis of Variance (ANOVA) and regression analysis. The name was coined by George W. Snedecor in honor of the famed mathematician and statistician, Sir Ronald Fisher. Fisher initially developed the statistic as the variance ratio in the 1920s.
The F test uses a ratio of the variances of your data groups. The null hypothesis (Ho) for the F test is that all variances are equal. If you wanted to determine whether one group of data came from the same population as another group, you would use the ratio of the larger variance over the smaller one. You would use the resulting F value and the F distribution to determine whether you could conclude the value of that ratio would allow you to reject the null hypothesis.
When the F ratio value is small (close to 1), the value of the numerator is close to the value of the denominator and you cannot reject the null hypothesis. However, when the F ratio is sufficiently large, that is an indication the value of the numerator is substantially different than the denominator and you can reject the null.
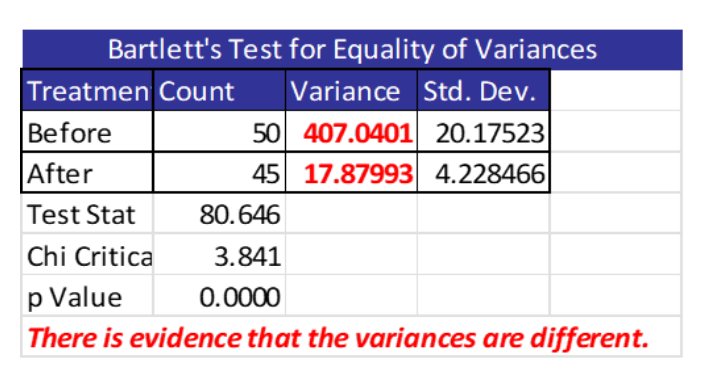
An industry example of the F test
The company Six Sigma Black Belt (BB) was interested in whether the invoice processing time was reduced after some improvement activities. She used a 2-sample t-test to test the difference in the average processing time and found no statistically significant difference.
She then decided to see if there was an improvement in the variation of the processing time. You can see the results below. She was happy to see that variation had been reduced and processing time was now more predictable so the manager could do a better job planning the work.
Frequently Asked Questions (FAQ) about the F test
What is the F test used for?
The F test is used to test the equality of population variances.
What is the difference between the F test, F ratio and F value?
The F test is used to test the difference between population variances. In ANOVA, the F ratio is the ratio of the variation between sample means and the variation within sample means. The F value is the resulting value from the F ratio and is used to determine whether to reject the null hypothesis.
What is the null hypothesis for the F test?
The null hypothesis is that all variances are equal. The alternative hypothesis is the variances are not equal.