
We have all used commonplace tools like PowerPoint and spreadsheets to train or inform our clients, colleagues and team members. There’s nothing wrong with using commonplace methods. Commonplace methods are expected, familiar and safe – like grown-up security blankets. But when it comes to teaching Lean at Covetrus, we’ve chosen a method of teaching that results in learning because it involves hands-on action – playing games!
Meeting Inattention
Studies have shown that after about 30 minutes into a meeting, the percentage of people paying attention falls dramatically.
| Attention Spans of Individuals in Meetings | |
| Length of Meeting (minutes) | People Paying Attention (percentage) |
| 0–15 | 91 |
| 15–30 | 84 |
| 30–45 | 73 |
| 45+ | 64 |
Or think about a study done by Microsoft that showed that human adults have an attention span that lasts only eight seconds. Compare that to a goldfish whose attention span is nine seconds!
Does it matter – statistically speaking – that less than 73% of your class is paying attention? Let’s use our trusty old hypothesis test:
- Null hypothesis = Not a big deal if only 73% vs. 100% of your class is paying attention
- Alternative hypothesis = Yes, this is a problem!
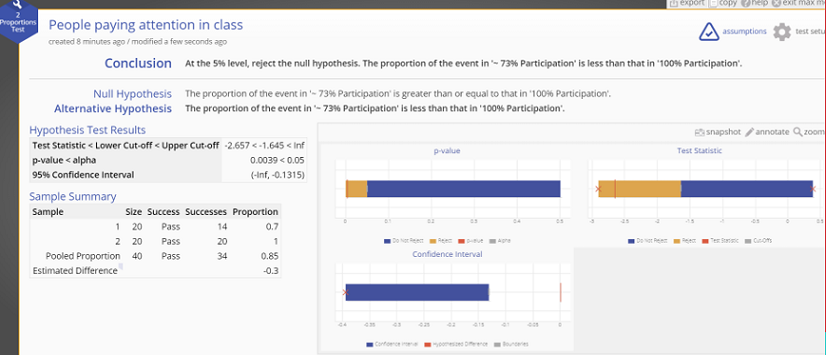
The conclusion of the analysis is to reject the null.
We have statistically verified that when only 73 percent of people are paying attention, it’s a problem. We propose that you can increase this percentage by busting out Legos to teach people about Lean and process lead time.
Teaching Process Lead Time
In the Covetrus Lean training program, we are translating statistical concepts to corporate groups of individuals who haven’t traditionally been exposed to Lean as well as distribution teams that are still working on building it into the culture. When you bring up the term “process lead time” to a group of people who don’t deal in Lean every day, they’ll tell you to buzz off! But knowledge transfer is extremely important as we work to build a Lean culture.
Process lead time is a point-in-time data point that tells us how long it will take if a new piece of work enters the system. Process lead time accounts for the other pieces of work in process (WIP) and how much work we can complete in a period of time (exit rate).
At Cedar Point amusement park in Sandusky, Ohio, when you get in line for the Millennium Force roller coaster, there are signs that tell you how much time it will take to get on the ride from that particular spot. This estimated time accounts for how long it will take to get riders through the ride (exit rate) and how many other people are already in line (WIP). Boom – process lead time in real life.

We care about this measurement because we want to give our customers realistic expectations as to how long it will take for those customers to get back their request. Imagine if you get your car serviced and Marcy Mechanic says, “Your car will be ready in 45 minutes.” Although it only takes 45 minutes to do this particular service, Marcy has forgotten to account for the other seven cars that need to be serviced before she can get to yours. You expect your car back in 45 minutes, but you won’t actually be getting it back for a whopping six hours. You probably won’t be a returning customer.
Time for Legos
Back to the classroom. How do we teach a technical concept like process lead time to folks who haven’t used this concept to measure their processes before AND not lose their interest? Legos.
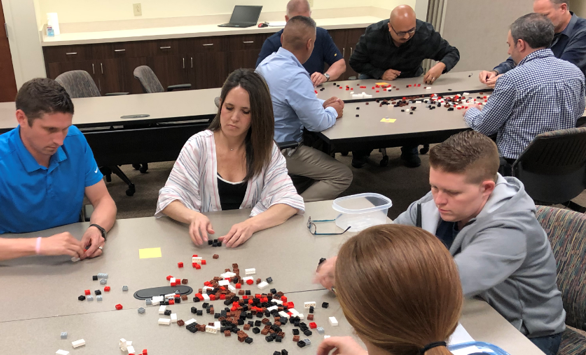
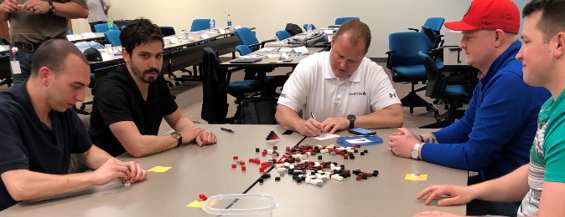
Class members get into teams of five and build Lego widgets over the course of three rounds of competition. Each round introduces a change to demonstrate continuous improvement and other Lean fundamentals. (A more complete description of the Covetrus Lego Game appears at the end of this article.)
During the game, the students are all engaged and constantly working on the widget. That eight-second attention span referenced earlier doesn’t stand – we are continuously asking them to move and think.
In between rounds, we talk through the key learnings (not via PowerPoint). We ask the students to tell us about their experience and document the results on flip chart paper. There are between three and five teams, so the competition starts to get exciting. The students are engaged because they are laser focused on the scores to see where they stand against the other teams. There is no opportunity for the students to disengage because we are constantly asking them to respond, think or do.
After the game, we find that the class is able to talk through what that Lego widget means to them. Since the pawn in the game is independent of work lingo, the students can explore on their own how this translates to their work life. For some, it is an order that needs to be packed and shipped. For others, it’s an invoice that needs to be processed and paid. And for the very few who work at Legoland, it actually is a Lego widget.
This hands-on engagement (game!) teaches Lean concepts in a way that PowerPoint and lectures can’t. The students learn by doing and connect with the methodology more successfully than traditional teaching methods alone. If your training programs don’t include group work – and some competition – consider spicing it up. A few Legos might be all it takes!
Highlights of the Lean Lego Game Played at Covetrus
In Round 1, the teams are instructed build in batches of five. Each assembler may only pass on to the next once they have completed five. The assemblers pass their pieces across the table to cause some chaos. The inspector measures how long it takes to get the first batch of five through, the number of defects and the total widgets produced. If the total produced is not a factor of five, we know they are trying to pull a fast one on us. We typically find there is poor performance in terms of process lead time because of the WIP and see only five or 10 widgets completed. This round runs for five minutes.
In Round 2 we still make batches of five, but implement a quick change (Kaizen). In this round there is a slight increase in total widgets produced. Quite a bit of WIP continues to cause the process lead time to suck. Round 2 is also five minutes long and we see the same step as the bottleneck.
Round 3 is where the magic happens. The teams stay in a position for flow to happen, only this time they are using a queue and one-piece flow. Each assembler can only work on a widget if the queue in front of them is empty and ready for the next piece of work. Again, we run the round for five minutes. As far as results, well, I don’t want to spoil the fun. But knowing that Round 3 forces us to have less opportunity for WIP, our process lead time performance looks much different.