If all the materials entering your inspection process were of perfect quality, the concept of AOQ would be moot since perfect incoming lots would mean perfect outgoing lots from inspection.
However, this may not always be the case.
We will examine what AOQ is, how the AOQ curve is developed, and the benefits and importance of your inspection and sampling procedure to prevent defective products from getting into your manufacturing process — or out to your customer.
Overview: What Is AOQ?
AOQ is defined as the expected average quality level of outgoing products coming out of inspection as a function of the quality of incoming products going into inspection.
AOQ is often represented in an AOQ curve. The AOQ curve shows the relationship between the incoming material’s quality and outgoing material’s quality. Further, it assumes rejected lots are 100% inspected, and defective items are either removed, reworked, or replaced. AOQL (average outgoing quality limit) is the maximum defective rate for the average outgoing quality.
A simple AOQ curve looks like this:
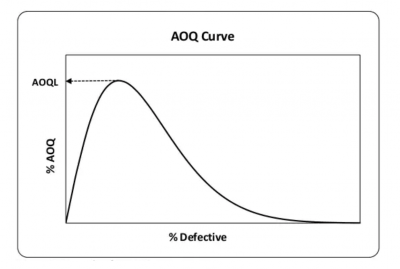
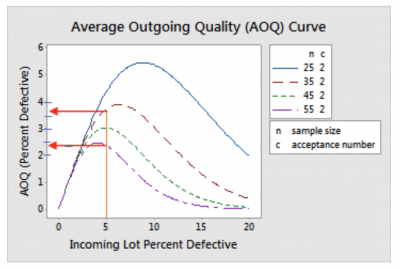
A more complex curve specifying sample sizes is shown below.
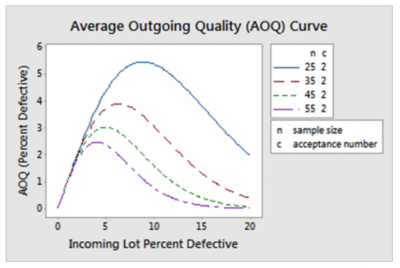
Note different curves depend on the sample size used in the inspection of incoming products. For a given level of incoming percent defective, the AOQ will decrease as the sample size increases. As sample size increases, AOQ is better than the incoming quality as a result of the 100% inspection of rejected lots and the removal of defective items.
Additionally, the AOQ curve initially increases as more defectives are produced. While more and more lots are rejected, 100% inspection becomes more common, and the AOQ curve starts to decrease at a rapid rate.
Calculating Average Output Quality
The formula for calculating AOQ is:
AOQ = [(N x Pd x Pa) – (n x Pd x Pa)] / N
Where:
- Pd = percent defective in each lot
- Pa = probability of accepting a lot with a given Pd
- N = lot size
- n = sample size of each lot
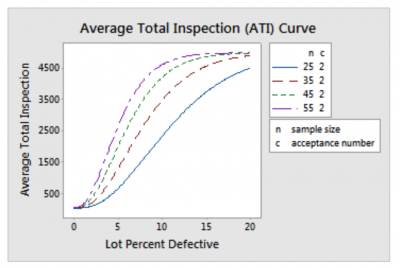
ATI (average total inspection) is the average total number of items inspected and depends on the incoming quality, probability of acceptance, and the lot and sample sizes. When your incoming quality has no defects, then inspect the specified sample size.
When the incoming quality has many defects, you must do a 100% inspection. Because quality levels vary between lots, the average number of items inspected over many lots will fall between 0% and 100% of the lot size.
The ATI curve shows the relationship between the quality of the incoming material and the number of items that need to be inspected, assuming that rejected lots will be 100% inspected and defective items will be removed, reworked, or replaced.
Below is an ATI curve.
3 Benefits of AOQ
It would be great if your average output quality was 0%, but that’s rarely the case. Here are some benefits of knowing the value of your AOQ.
1. Defines the Quality of Your Output
AOQ is the expected average percent defective of your outgoing product after inspection and replacement of a bad product. This is a good descriptor of the process performance of your supplier or your process.
2. Aids in the Selection of the Most Appropriate Inspection Strategy
AOQ is linked to the concept of acceptance sampling and can be used to determine the optimal sample size for inspection.
3. The AOQ curve
The AOQ curve can be used to visually represent the relationship between expected average incoming and outgoing quality.
Why Is AOQ Important to Understand?
Average output quality is a good indicator of quality, so it’s important to understand how to interpret it and work to improve it.
Quality of Your Supplier
Using incoming inspection and calculating AOQ to determine the quality of your supplier provides quantitative data to discuss quality concerns with your supplier.
Link to Acceptance Sampling
Using the average output quality and ATI curves will allow you to sample the correct number of incoming items so you have assurances you will be able to determine whether to reject a lot or not.
Relationship Between Incoming and Outgoing Quality
When the incoming quality level is high (low percent defective coming in), the AOQ is also high (low percent defective going out). Good material coming in means good material going out.
AOQ will peak when the incoming quality level is low to marginal. AOQ improves as the incoming quality level deteriorates because the incoming lots are rejected, 100% sorted, and the defectives are replaced with good products.
An Industry Example of AOQ
Juicy Juice company did an incoming inspection of its bottles. Bottles were received in lot sizes of 5,000. The quality control (QC) department had been using a sample size of 35 with an acceptance number of 2. That is, if there are more than two bad bottles, the lot is rejected, and a 100% inspection is done with the bad bottles being replaced before sending the lot to production.
Historically, the supplier has had an incoming defective rate of approximately 5%.
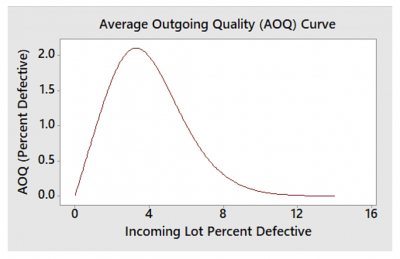
Recently, production has been complaining they seem to be receiving more defective bottles than before. Using the AOQ curve below, you can see that an incoming defective rate of 5% will translate to an AOQ of approximately 3.6%. The production manager informed QC it was not acceptable.
By switching to a sample size of 55, the AOQ dropped to approximately 2.4%.
While this helped reduce the rejections in production, it was additional work for QC. The plant manager set up a meeting with the bottle supplier to discuss how they were going to improve their process, or else Juicy Juice would seek a new supplier.
3 Best Practices When Thinking About AOQ
Here are some suggested best practices when using AOQ to understand your quality level.
Measurement System Analysis (MSA)
You need to be sure your inspection processes are capable of providing repeatable and reproducible outcomes so your calculations are correct and decisions appropriate.
Use OC, AOQ, and ATI curves
Use these curves to have a visual picture of the appropriate sample sizes and quality levels.
Acceptance Sampling
Develop an understanding of the different sampling schemes to determine the best form of acceptance sampling to use for your organization.
Other Useful Tools and Concepts
While we’ve discussed average outgoing quality at length, that isn’t the only way to take control of your processes. Paying close attention to the waste inherent in any organization or process is one effective way to minimize problems. The 7 wastes of Lean are common and deserve your full attention.
Additionally, you might need some extra help squaring up your processes. Implementing a process control plan enables you to focus on process improvement while also accounting for any possible degradation that might arise.
Summing Up AOQ
Average outgoing quality (AOQ) is the expected average quality level of an outgoing product for a given value of incoming product quality after an inspection is performed on the incoming product. An AOQ curve represents this relationship.
When incoming lots are of high quality, the outgoing quality will also be good. When the incoming lot contains defects, the outgoing quality will still be good because lots are inspected 100% and defective products are fixed or replaced.
The graph below shows the relationship between incoming quality and outgoing quality.