
Brainstorming Rules
Published:Effective brainstorming can be accomplished by following simple brainstorming do’s and don’ts with your team. A brainstorming session is a tool for generating as many ideas or solutions as possible to a problem or issue. It is not a tool for determining the best solution to a problem or issue. Before beginning any effective brainstorming […]
Read morePareto Principle (80/20 Rule)
Published:Vilfredo Pareto was an economist who is credited with establishing what is now widely known as the Pareto Principle or 80/20 rule. When he discovered the principle, it established that 80 percent of the land in Italy was owned by 20 percent of the population. Later, he discovered that the pareto principle was valid in other parts […]
Read moreBar Chart
Published:Purpose of a Bar Chart A bar chart is used to graphically summarize and display the differences between groups of data. How to Construct a Bar Chart A bar chart can be constructed by segmenting the range of the data into groups (also called segments, bins or classes). For example, if your data ranges from […]
Read moreHistogram
Published:Purpose of a Histogram A histogram is used to graphically summarize and display the distribution of a process data set. How to Construct a Histogram A histogram can be constructed by segmenting the range of the data into equal sized bins (also called segments, groups or classes). For example, if your data ranges from 1.1 to 1.8, […]
Read more
The Cause and Effect (a.k.a. Fishbone) Diagram
Updated:When utilizing a team approach to problem solving, there are often many opinions as to the problem’s root cause. One way to capture these different ideas and stimulate the team’s brainstorming on root causes is the cause and effect diagram, commonly called a fishbone. The fishbone will help to visually display the many potential causes […]
Read moreGE’s Six Sigma Focus On Span
Published:We have heard about GE being one of the biggest proponents of Six Sigma, both for their own processes and for their customers. We’ve also heard how much GE has saved by implementing Six Sigma. This article is not a regurgitation of the existing rhetoric. Instead, I’d like to focus on an aspect of how […]
Read moreWhy Control Chart Your Processes?
Published:Control charting is a tool used to monitor processes and to assure that they remain in control or stable. Proposed by Walter Shewart in 1924, control charts help distinguish process variation due to assignable causes from those due to unassignable causes. Table 1: Types of Process Variation Found on a Control Chart Types of Variation Variation […]
Read moreHow Mistake Proof Are Your Processes?
Published:It was a Japanese manufacturing engineer named Shigeo Shingo who developed the concept that revolutionized the quality profession in Japan. Originally called “fool proofing” and later changed to “mistake proofing” and “fail safing” so employees weren’t offended, poka yoke (pronounced “poh-kah yoh-kay”) translates into English as to avoid (yokeru) inadvertent errors (poka). The result is […]
Read moreSix Sigma Project Review Sample Agenda
Published:You’ve selected your Six Sigma projects, even chartered one, and now you’re business is trying to figure out the status of the project and it should move to the next phase. Charles Waxer presented the article, Successful Six Sigma Project Reviews. I would like to help you make those words of wisdom a reality by […]
Read moreWhat Is a Stable Process?
Published:Process stability is one of the most important concepts of the Six Sigma methodology, or any quality improvement methodology for that matter. Stability involves achieving consistent and, ultimately, higher process yields through the application of an improvement methodology. Does a process need to be stable in order for a black belt to improve it? Try […]
Read more
The Purpose and Practicality of Pareto Charts
Updated:Purpose of a Pareto Chart A pareto chart is used to graphically summarize and display the relative importance of the differences between groups of data. Sample Pareto Chart Depiction How to Construct a Pareto Chart A pareto chart can be constructed by segmenting the range of the data into groups (also called segments, bins or categories). […]
Read more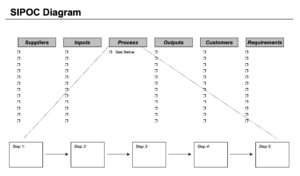
SIPOC Diagram
Updated:Many recent inquiries and discussions have focused on the SIPOC diagram – a tool used in the Six Sigma methodology. Because of the interest level, a further explanation is presented here along with a sample and template for your use. A SIPOC diagram is a tool used by a team to identify all relevant elements […]
Read more
What Is Lean Manufacturing?
Published:Lean management – often called “Lean Management,” “The Toyota Way” or simply “Lean” – is a systematic method for waste minimization and process improvement in any type of service or manufacturing
Read more