How hard can it be to make orange juice?
As one large global company found out, no single Six Sigma tool will solve all the problems in an organization. However, the integration of a number of tools such as correlation, Measurement System Analysis (MSA), control charts, and process capability will help solve many of them.
The global consumer products company in question produced such food products as cookies, peanut butter, chips, coffee, and orange juice. This story is about the application of some Six Sigma tools in its manufacturing of orange juice.
This company had a number of problems that were costing it money
The process of producing one-half-gallon cartons of orange juice is quite simple. Orange trees are grown in company-owned groves in Florida. The oranges are picked and sent to a local site for squeezing and conversion into orange juice concentrate. All pulp is removed and stored separately as frozen blocks. The liquid juice concentrate is put into tanker trucks and shipped to the manufacturing site in Texas. The pulp is sent in a special freezer truck.
Problem No. 1
Prior to shipping, quality control tests are performed by drawing a liquid sample from the tanker truck at the top, middle, and bottom of the tank. The primary test is for brix, which is a measure of the sugar content of the juice and one of the most important characteristics of taste.
Once the truck arrives at the manufacturing plant, another quality control test is performed for brix. The results are compared to the tests received from Florida, and a decision is made on whether to accept or reject the lot.
The problem for this company was, most of the time, the Texas test results were lower than those provided by Florida, so lots were often rejected. This resulted in waste and affected the manufacturing schedule.
We will get to the reasons and solutions in the next section.
When ready for production, the concentrate is put into a large tank, and water is added to reconstitute it back into a liquid form rather than the syrup consistency of the concentrate. If the specific production run requires pulp, the frozen blocks are put into the tank and stirred until there is a consistent blend.
Problem No. 2
The second problem was occurring during the filling process.
Empty one-half-gallon cartons are transported by conveyor belt to the filling station, where one nozzle dispenses 1/4th of the fill before moving to subsequent fill nozzles, each dispensing 1/4th of the volume until the carton reaches its targeted fill level.
The filled container then moves across a scale, where weight is used as the determinant of correct fill level. If the weight is not within specifications, a metal arm moves across the belt and pushes the carton onto a cart. The rejected cartons are later emptied back into the tank for reprocessing.
The problem was that it wasn’t unusual to hear the sound wap splat, wap splat coming from the scale location due to a fill problem. As a result of the number of cartons rejected, the cart quickly filled up, and cartons were falling off, hitting the floor, and spilling the contents. Hence, the sound of wap splat as the cartons hit the floor. These could not be reprocessed.
Problem No. 3
Problem three was, for the cartons that weren’t rejected, the variation of fill level either resulted in an underfill, which required the rejection of a carton, or overfill, where excess volume was being put in the carton that was not being paid for by the customer.
Now that you understand the multiple manufacturing problems the company faced, let’s see how they dealt with them.
Through the application of selected Six Sigma tools, product rejection and fill variation were reduced
The first problem to solve was to answer the question why there was a difference in the test results between Florida and Texas.
The company had just embarked upon a Six Sigma deployment and had recently hired an experienced Master Black Belt (MBB). Julia, the MBB, was asked to head up a team of manufacturing and quality control employees seeking to understand and solve this problem.
Correlation analysis
Julia suggested doing a simple correlation analysis to see if there was any definable relationship between the Florida and Texas test results.
Julia took the most recent matching 50 test results from both sites and entered them into her statistical software program. The results indicated an r value or Pearson correlation close to zero, indicating essentially no linear statistical relationship between the sites. Assuming no change occurred to the concentrate while traveling from Florida to Texas in a sealed tanker truck, the reason was a mystery.
MSA study
Julia recommended both Florida and Texas conduct an MSA study to determine whether the test and measurement system procedures could be validated and trusted. The outcome of the MSA study will be discussed later.
Root cause analysis
Julia then had the team explore why the fill operation seemed to randomly degrade, and it wasn’t until there was a symphony of wap splats before it was discovered there was a problem.
Doing a root cause analysis, Julia and the team discovered this problem only happened when the product had added pulp. Apparently, the nozzles slowly got plugged up with the pulp and therefore weren’t filling the total expected amount. This resulted in the product being swept off the conveyor belt as it went across the scale.
The question to be answered was why wasn’t there any warning at the scale indicating the nozzles weren’t dispensing the correct volume. The answer will be revealed shortly.
Process capability study
Finally, Julia and the team turned their attention to the over- and underfill problem. Since the definitions of over- and underfill were detailed in the product specifications, Julia did a process capability study and found the variation in fill would provide a high probability of violating both the upper and lower specifications established by quality control.
Again, she and the team used root cause analysis to try and determine the source of that excessive variation. The outcome will surprise you.
Surprisingly, there was no resistance to the use of the Six Sigma tools
Although the use of these tools was new to the company, there was no resistance to the application of them to help solve the myriad manufacturing problems they were facing. The logical sequencing of the tools coupled with their relative simplicity helped keep the leadership, team, and manufacturing staff engaged and enthusiastic.
The takeaway is to employ the KISS (keep it simple and specific) method as often as possible, and don’t bite off more than you can chew at once.
How each problem solution helped reduce waste, product rejections, and fill variation
Recall the company’s first problem was the lack of any correlation between the test results from Florida and Texas.
After doing the MSA, Julia concluded the test procedures were not the same despite the protocols specified in the testing documents. Her first step was to assure both protocols were reviewed and revised so they were being done the same way at both locations. Once that was done, new correlation studies showed a very strong correlation between the two sites.
As a result, a decision was made to cease doing the testing in Florida on all lots and use the Texas results for decisions on rejection. Instead, Florida would randomly test a small number of tanker trucks and compare the results with Texas. If the results maintained their correlation, then eventually, all testing in Florida would be discontinued.
Once accomplished, this would save approximately $895,000 in staffing and testing expenses.
When Julia and the team investigated the nozzle clogging problem, they found that the scale did have the ability to produce control charts that would show any significant decline in the volume being dispensed. The control chart would provide a signal so the operator could clean the nozzle head of the build-up in pulp, effectively reducing the number of cartons being swept off the line to practically zero.
When asked why the control chart function was not being used, the supervisor said, “The computer used to do that is in a locked box at machine side. Someone broke off a key in the lock, and nobody has gotten around to fixing it.” Julia was astounded, and the plant manager was livid. This problem was corrected immediately.
The reject rate at the fill station was reduced from 5.3% to 0.94%.
Finally, after doing the root cause analysis for over- and underfill, the team discovered a few answers. First, since underfill results in carton rejection, operators were encouraged to run on the high side since the small overfill didn’t directly impact them or their KPIs (key performance indicators).
The issue of underfill was rectified by the change made for the problem described in the previous paragraph. The final solution was to dial back on the nozzle settings so the overfill was eliminated, except on rare occasions not linked to any of the problems already discussed.
These solutions reduced waste and scrap from underfill and improved yield by reducing overfill.
3 best practices when implementing Six Sigma tools
There is little argument about the value of using Six Sigma tools and methods to improve your processes. But, resistance to their use can seriously curtail the value, so here are a few tips to prevent that from happening.
1. Don’t make it too complex
There are many Six Sigma tools to use that don’t require extensive and complex analytics. Start with those. With the abundance of statistical software available today, there is no need to make things intimidating.
2. Don’t bite off more than you can chew
Because Six Sigma tools are so powerful and often fun to use, don’t be tempted to apply too many of them at one time. Go slow so you don’t overwhelm your organization – or the people trying to use the tools.
3. Use the right tool for the situation
Heed this piece of advice: Don’t have a tool in search of a problem; instead, search for the right tool for your problem.
Using the right Six Sigma tool for the appropriate application can help your organization solve problems and reap benefits
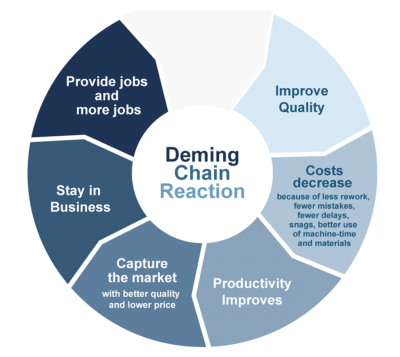
Every organization has problems to solve both in manufacturing and non-manufacturing functions. Identifying what your problem really is and then combining the appropriate tools to eliminate or reduce the problem will help you create the Deming Chain Reaction, as shown below. That is what this company did.