
Chi-square analysis is a powerful tool for examining the relationship between variables formatted in a table. One consumer products company used it to look at its consumers in a different way, resulting in a significant increase in sales and profitability of its product portfolio.
Traditionally, an organization’s sales and marketing department makes advertising decisions based on the demographics of their consumer base. A national consumer products company decided to take a different approach.
Let’s call this company “Giant Beverages (GB).” GB products were sold to a variety of customers including large food chains, big box stores, convenience and drug chains, and vending machines in the food industry. These distribution channels then sold GB products to consumers.
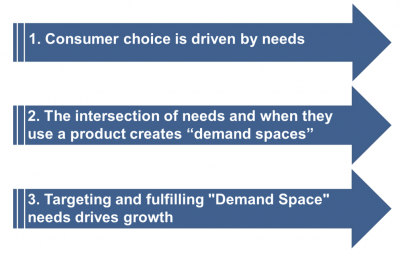
Their new strategy was to match up their product portfolio to when and how their consumers actually consume the product. This allowed the company to create brand strategies to better meet consumer needs. They were able to increase sales by:
- Optimizing their product portfolio
- Looking at consumers in a different way
- Having better insight into consumer needs
As a result of this realignment, the company was able to increase its market penetration and improve total portfolio sales by 8.9%.
GB needed to do things differently
GB is an international beverage company selling a wide range of waters, carbonated soda drinks (csd), juices, and teas. All products are sold through large international distribution channels. Their traditional brand strategy was to identify demographic characteristics of their consumer base to develop promotions and direct advertising. These included gender, age, geographic, income, race and ethnicity.
The impetus for doing something different was based on the following conditions:
- The rapid pace of change in products was creating continued challenges to growth.
- Consumers’ needs and preferences were shifting.
- GB was facing a growing number of competitors and a decline in the business’s core product category.
- Customers were looking for help to drive growth in their consumer base.
A well-known international consulting company was hired to help GB formulate a strategy to compete with growing and more innovative companies in their market. The consultant suggested that, rather than use demographics to help develop marketing materials, why not base their strategy on what they called, “demand spaces.” The consultant’s objectives were to create sustainable growth by:
- Looking at products through the consumer’s eyes
- Tailoring the brand strategy to meet consumer needs
- Creating commercial tactics to support brand strategy
- Aligning the organization behind a clear set of priorities
The initial goal was to try and understand how consumers make their choice between GB and competitors products. Below is the core strategy.
The consultant engaged Chuck, one of GB’s senior Six Sigma Master Black Belts, to assist with the project. Collecting the necessary data for analyzing the strategy was a challenge since the consumer base was international and the product portfolio was large.
Keeping things simple, here is the approach they used to collect the data:
- A major survey was done of which the core questions were rather simple (22,000 respondents).
- People were asked when did they last use a certain category of product (csd, tea, water, milk, spirits, juices, etc.) regardless of brand.
- The key follow up questions were:
- Specifically which type of product?
- How did you feel?
- What time of day did you use it?
- Where were you when you used it?
- Who were you with?
Principal component analysis, or PCA, is a statistical procedure that allows you to summarize the information content in large data tables. The consultant intended to use this statistical tool for analysis once the data collection was completed.
Chuck proposed a simpler first pass approach to start with. Here is what they used.
GB started with a chi-square analysis rather than the principal component analysis
Chi-square analysis is a statistical tool for examining relationships or associations between values captured in a table format. It is less complex than the PCA approach but would provide a quick first glance before diving deeper with PCA.
First, let’s take a look at how chi-square analysis works to help you understand what GB did.
The basic table layout and calculations are shown in the graphic below.
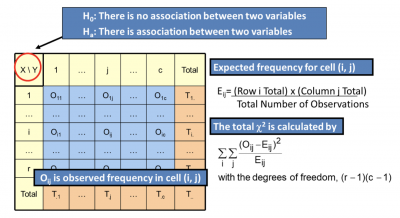
Click on the following links to refresh yourself with some of the terminology used above:
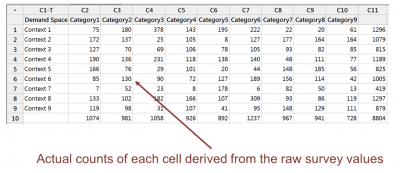
Here is the format for the actual chi-square table with data.
Here is a facsimile subset of the computer output:
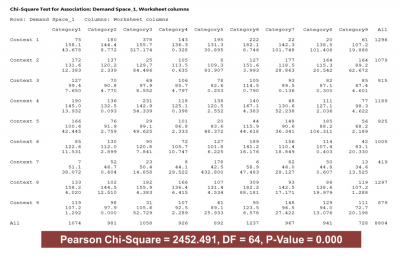
The p-value of 0.000 is an indication the null hypothesis can be rejected (no association between category and context) and the alternative hypothesis can be accepted (there is an association between category and context).
The next table is useful for explaining how Chuck interpreted the final output above.
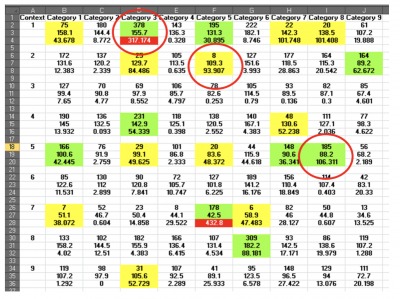
Note, that for each pairing of Category and Context there are three numbers. The top number is the actual number of responses for that question. The middle number is the value you would expect to see if there was no association. The last number is the total calculated chi-square value.
Chuck interpreted the red circle in the top row to mean there were 378 actual responses when asked about the specific product Category 3 used in Context 3. If there was no association between category and context, Chuck would have expected to see a theoretical value of 155.7. The 317.174 indicates this pairing had a significant impact on the total chi-square value and the use was more than expected.
This is a key finding.
The red circle in the second row shows the actual response was only 8 when you expected 109.3. Your actual response was less than what you expected. This could be interpreted as meaning don’t promote product Category 5 in Context 2 because people don’t really associate the use of product Category 5 in Context 2.
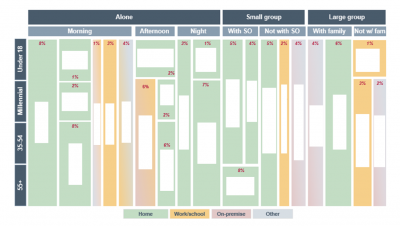
In the final analysis, the consultant and Chuck overlaid the information from the chi-square results with GB’s product portfolio and came up with the following graphic showing context, product category, time of day, who they were with, and an age demographic.
Using a design space strategy was better than just demographics
The complete data collection and analysis took five months to complete. Using the chi-square analysis was quick, and people were able to understand it quite easily.
While waiting for the complete PCA to be done, sales and marketing started the process of evaluating the degree to which GB had products to fill the most impactful design spaces and what the current market share was. Senior leadership also decided to engage everyone in this concept regardless of what function they were in.
A 5% bonus was made part of the overall bonus structure, which meant everyone in the organization was encouraged to do what they could to support the execution of the new programs and marketing strategy.
The new strategy worked, resulting in increased sales and engagement of company associates
Based on the final analysis, GB was able to identify where they had products in many of the design spaces. They were able to determine whether they had a dominant position and market share or were not very competitive.
Where a design space was significantly positive, GB decided to either increase its presence through better advertising and promotions, enter the design space by introducing a new product, or ignore the opportunity if the cost benefit analysis showed it wasn’t financially viable.
For example, one of the top opportunities was for alcoholic spirits consumed with a group of friends relaxing after work. Unfortunately, GB did not have an alcoholic product, so they had to pass on that opportunity.
Once the final portfolio was mapped out, Marketing developed a series of advertisements and promotions targeted for specific design spaces. For example, the data showed that one diet cola was most often consumed by a woman at the end of the work day seeking to relax. The ad showed that scenario. Another product was most popular when consumed by a group of young adults out for a good time, usually at a drinking establishment. And, that is what the ad depicted.
Where a current product did not exist for a specific design space, a decision was made whether to develop one or not bother competing against a strong competitor. Since the overall success of the new strategy would affect most employees because of the inclusion in the bonus structure, everyone was sensitive to what they had to do to make this approach successful.
3 best practices when implementing chi-square analysis for analyzing your data
The sales and marketing function had not used this type of statistical analysis as part of their normal way of looking at data. Here are a few hints to help facilitate the application of more advanced statistical tools.
1. Teach people the basics
While it would be easy to let the consultant do all the work and for leadership to passively accept what they are told, that is not a good approach. GB had Chuck teach the basics of statistical analysis including such tools as chi-square analysis, regression, MSA, and control charts. This allowed the leadership to better understand the consultant’s conclusions and to question their recommendations.
2. Use the simple tool first
While the use of PCA would result in more robust and in depth analysis, it was wise for GB to start with the simpler chi-square analysis. There is no sense spending a lot of time and resources if the outcomes will not provide much value. The chi-square analysis allowed for a quick glance and directional indicator of what a more comprehensive tool might reveal.
3. Most statistical tools are flexible
While most people think of manufacturing as the only function to use advanced statistical tools, that is not true. Chi-square analysis and most other statistical tools can be used in most of your organizational functions.
Chi-square made the difference in helping GB utilize a new marketing strategy and improve sales
The first big challenge for GB was to move away from the traditional demographic model for advertising to its consumers to the more innovative concept of design spaces. To be comfortable with this significant shift in thinking, GB wanted to collect a large amount of data. The large data set required the use of some advanced statistical tools. Chi-square analysis was the most appropriate for the objectives of their study.
After analyzing the data, GB was able to map their product portfolio to the combination of consumer needs that had the best opportunity for increased sales. By making the success of the new strategy part of the bonus program, employees were motivated to consider how they can help support the strategy. Within a year, most new targeted advertisements had gone live, and the vice president of sales and marketing reported an increase of almost 9% and an outlook for additional lift in sales for the next year.