
Degrees of Freedom (DF) can be thought of as the amount of information you have to compute certain statistics. The more you want to compute, the more data and information you need. Let’s learn more about how to compute and use DF.
You can think of DF as statistical money that you can spend to compute certain statistics. Different statistics require differing amounts of money. The amount of your DF is determined by the number of data points you have. If you run out of your money, you can either get more by collecting more data or spend less by asking for less computations.
Overview: What are degrees of freedom?
Degrees of freedom refer to the number of values in a statistical calculation that are free to vary after certain constraints have been placed on the data. In other words, degrees of freedom are the number of values in a calculation that can be varied without affecting the final outcome of the calculation.
Degrees of freedom are important in statistical inference because they determine the accuracy of statistical estimates and test statistics. In general, as the number of degrees of freedom increases, the accuracy of the estimate or test statistic improves.
Degrees of freedom are used in many statistical tests, including t-tests, F-tests, and chi-square tests. In a t-test, for example, the degrees of freedom are the number of observations minus the number of parameters estimated from the data (usually one for the mean). In an F-test, the degrees of freedom are the number of groups minus one for the numerator and the total number of observations minus the number of groups for the denominator.
The degrees of freedom formula is straightforward. Calculating the degrees of freedom is often the sample size minus the number of parameters you’re estimating:
DF = N – P
Where:
- N = sample size
- P = the number of parameters or relationships
For example, the degrees of freedom formula for a 1-sample t test equals N – 1 because you’re estimating one parameter, the mean. To calculate degrees of freedom for a 2-sample t-test, use N – 2 because there are now two parameters to estimate. If you are using statistical software, the DF will be displayed and if it isn’t adequate from your requested calculations, the software will alert you so that you either get more data or use a simpler statistic.
An industry example of degrees of freedom
The manufacturing engineer was interested in determining whether there was a statistical difference between three production lines. The company Six Sigma Black Belt recommended that an ANOVA test be run. Below is the output from a well-known statistical software.
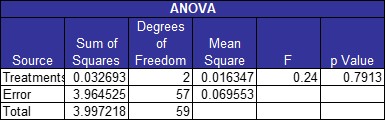
The Degrees of Freedom were calculated as follows:
- Treatments – number of groups – 1 = 3 – 1 = 2
- Error – number of data points (60) – number of groups (3) = 57
- Total – number of data points (60) – 1 = 59
Frequently Asked Questions (FAQ) about degrees of freedom
What is the importance of degrees of freedom in statistical analysis?
Degrees of freedom determine the accuracy of statistical estimates and test statistics. In general, as the number of degrees of freedom increases, the accuracy of the estimate or test statistic improves.
How are degrees of freedom calculated in different statistical tests?
Degrees of freedom are calculated differently in different statistical tests. In a t-test, for example, the degrees of freedom are the number of observations minus the number of parameters estimated from the data (usually one for the mean). In an F-test, the degrees of freedom are the number of groups minus one for the numerator and the total number of observations minus the number of groups for the denominator.
What happens if degrees of freedom are too low in a statistical test?
If degrees of freedom are too low, the accuracy of statistical estimates and test statistics may be affected, and the test may have reduced power to detect true effects.
Can degrees of freedom be negative?
No, degrees of freedom cannot be negative. The minimum value of degrees of freedom is zero.
How do I interpret degrees of freedom in statistical output?
Degrees of freedom are often reported alongside statistical output, such as test statistics and p-values. They provide information about the number of values in the calculation that are free to vary after certain constraints have been placed on the data.
Can I increase degrees of freedom in my analysis?
Degrees of freedom are determined by the number of observations and the number of parameters estimated from the data. Increasing the sample size or reducing the number of estimated parameters can increase degrees of freedom in some statistical tests.
How can I ensure accurate use of degrees of freedom in my analysis?
To ensure accurate use of degrees of freedom in statistical analysis, it is important to understand the specific formula for calculating degrees of freedom in each test and to use appropriate software that calculates degrees of freedom correctly.