A Lean Six Sigma (LSS) team within a manufacturing quality testing laboratory environment identified gaps in rescue-and-response standard work for a Bolling mill machine. The Bolling mill is a type of calender (or smoothing) mill used to mechanically process uniform sheets of rubber. In the laboratory environment, the Bolling mill supports quality assurance testing of production and pilot recipes. But as so often can be the case with machinery, this machine poses a danger to its operators. Operators feed stock rubber for mixing and sheeting into exposed rollers. One careless moment can lead to an individual needing to be rescued from the rollers and pinch points. The rescue-and-response standard work refers to the procedure for performing such a rescue.
This facility’s Six Sigma coordinator was touching base with team members who had gone through Yellow Belt training but had yet to complete a certifying project. An uncertified Yellow Belt new to this lab environment identified the opportunity to improve the Bolling mill rescue-and-response standard work. The team member was partnered with a mentor LSS Black Belt located at the facility. Then, the project was chartered and a team was formed to improve the rescue-and-response time for the Bolling mill machine.
Defining and Measuring the Current State
The improvement team began to scope and define the problem, following an A3 project format. The Bolling mill machine supports multiple production tests and trials for the 24/7 production facility. The machine is intended to be operating, on average, three to four hours per 12-hour shift. The team went through instructions and breakdown during a current-state assessment of rescue standard work.
As a part of the current-state assessment, the team established a baseline performance to the standard work for rescue-and-response time by conducting a structured gemba activity. The gemba activity involved a role-play drill to the current standard work; the exercise was video recorded for data collection and subsequent review. While reviewing and performing this drill, the team observed deficiencies in the standard work to perform the rescue. The team defined a baseline rescue-and-response time (7.14-minutes) while noting that rescue tools and supplies were difficult to find during the training exercise (Figure 1).

Analysis to Close the Gaps
The team mapped the current-state process flow (Figure 2) to see the process of rescue and response and to call out the obstacles and gaps within the process. An analysis of the Bolling mill machine operation standard work revealed several gaps between the needs identified in the gemba and the work standard. Data supporting the standard work analysis was available from the drill exercise video recording. The results were worrying.
- Clear instructions for extraction and rescue from the Bolling mill in an emergency situation were not included in the standard work.
- The roles and responsibilities for team members responding to an emergency situation were found in the standard work but were unclear.
- Finally, the rescue tools and supplies required by the standard work were could not be located in the work environment and therefore could not be put to use in a timely manner.
- Waste in the forms of waiting, extra processing, transportation and motion were also evidenced during the drill exercise.

Next, the team brainstormed and created an affinity diagram of the observations from the drill exercise. This led to the construction of a fishbone diagram. The team presented the affinity and fishbone diagrams to the laboratory team, collaborating to ensure best practices and tribal knowledge were not overlooked.
The working sessions between the improvement and laboratory teams validated the scope and problem statement for the project. The current-state assessment helped the team to understand and establish the baseline and also clarified which stakeholders would contribute, influence and enable the project.
The team moved the work forward by taking the collaborative fishbone diagram and identifying primary root causes using the 5 Whys. The root cause analysis was developed through interviews and working sessions and included several laboratory team members. A future-state process map was created, including proposed countermeasures. The team validated the countermeasures through gemba and analysis of the drill exercise video which supported prioritizing the improvement actions.
Improvement Actions Prepared
Priority countermeasures identified by the team were summarized as:
- Marked the mill machine with arrows indicating correct open direction
- Placed rescue tools and supplies (including sledgehammer, flashlight, nylon and steel wedges, wrenches, pry bars, PPE, utility knife, first aid supplies and a sealed bloodborne pathogen kit) in a cart on wheels (Figure 3)
- Floor markings designated a “no parking zone” reserved for the rescue response cart
- Job instruction posted at point of use
- Converted written standard work to video standard work
The team implemented the improvement actions in a phased approach. Prior to implementing countermeasures that required a commitment of resources, the team performed a pilot test. The future-state drill collected measurable results; the exercise was video recorded for data collection and analysis. The team measured a future-state rescue-and-response drill exercise time of 4.59 minutes – a 2.55-minute (35 percent) improvement.

The team created a focused communication plan, inclusive of the stakeholders identified through the project. The communication plan detailed the changes and improvements that the project accomplished and determined a go-live date for the implementation of the standard work, training and countermeasures.
Sustaining the Improvements
The team created a control plan to sustain the countermeasures and improvements implemented by the project. An area of focus that reflected efficiency improvement and results was correlated to the location of rescue tools and supplies. The new cart would be audited on a weekly basis, performed using a barcode scan of the tools and supplies, and producing an audit accountability record with traceability. The audit would include taking actions if tools and supplies were missing.
The team determined through a barriers-and-aids analysis that drill frequency was inadequate; the frequency of Bolling mill machine rescue-and-response drills was increased from annually to quarterly. The standard was updated to perform functional safety checks every shift for the Bolling mill machine, ensuring the safety features and interlocks of the machine respond appropriately.
This functional safety check is performed through a hand-scanner application, producing an audit accountability record with traceability.
Conclusion
In a positive safety culture, existing safety processes are constantly improved. This project was proactive in its approach, openly communicated and employees were engaged to spark positive improvement. The project’s success is entirely due to involving the experience and tasks of the frontline team.
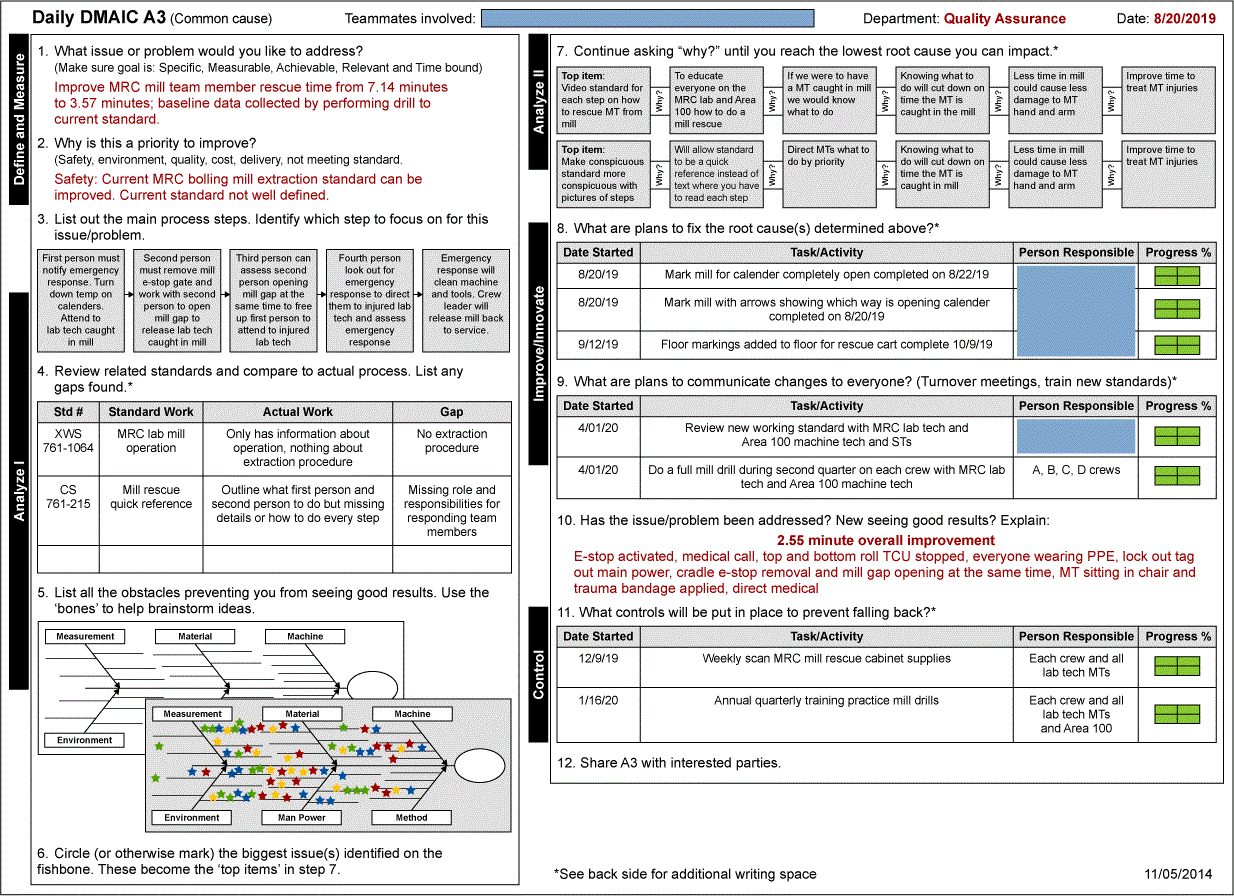
The benefits of increased drill frequency will allow for the laboratory team to gain more experience with the standard work-and-rescue process, being prepared should an actual event occur. Using the LSS problem-solving methodology the team identified process drivers to arrive at root causation, created effective countermeasures and avoided iterative cycles of fix and hope for improvement. (Figures 4 and 5 show the project’s results within the A3 format.) The project was selected to share with the company’s Voluntary Protection Program recertification team because it exhibited excellent employee-driven improvement.


Overall, this project resulted in:
- A team member completing their Yellow Belt project and earning their certification.
- The facility gaining more advocates for continuous improvement.
- The response time for a safety incident improving from 7.14 minutes (baseline) to 4.59 minutes, a reduction of 35 percent.