
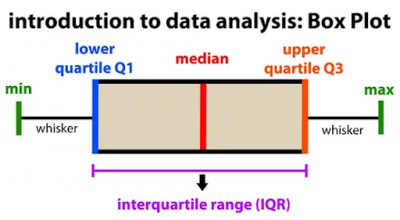
In a nutshell, if you order your data in sequence and subdivide it into quartiles, the interquartile range (IQR) is the range of values containing 50% of your data. This will be in the form of a box plot, so let’s check it out.
Overview: What is IQR?
In descriptive statistics, the interquartile range is a measure of statistical spread or dispersion. It is defined as the mathematical difference between the third (75th percentile) and first (25th percentile) quartiles of the data. This will represent 50% of your data. The graphic below of a box plot is the best way to see what this means.
An industry example of IQR
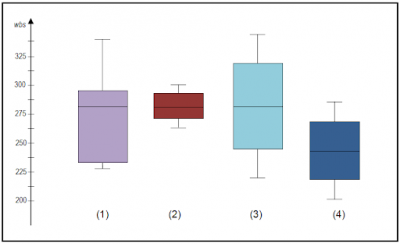
The finance manager was reviewing data for his department’s invoice processing time. Below is a box plot of the turnaround time for his four invoice clerks. You can see that the median time for clerk 4 was the lowest while clerks 1, 2 and 3 had similar median processing times. But, it became obvious the variation of clerk 2’s time was considerably less than clerks 1, 3 and 4. This can be seen in the lower value of the IQR represented by the height of the box itself. The manager decided to investigate and find out how clerk 2 was able to have so little variation compared to the other clerks. Then, he could offer recommendations to the others so they can reduce their variation as well.
Frequently Asked Questions (FAQ) about IQR
How do I calculate IQR?
Step 1 is to order your data from high to low. Next, read down from the top to the 75th percentile value and record it. Now, read up to the 25th percentile value and note it. The IQR will be the mathematical difference between the two values and will represent the range which encompasses 50% of your data.
How can I graphically show the IQR?
A popular tool for displaying the IQR is the box plot.
Can you show me how to calculate the IQR?
For example, consider the following numbers: 1, 6, 8, 10, 10, 12, 14, 22. Q1 is the middle value in the first half of the data set. Since there are an even number of data points in the first half of the data set, the middle value is the average of the two middle values; that is, Q1 = (6 + 8)/2 or Q1 = 7. Q3 is the middle value in the second half of the data set. Again, since the second half of the data set has an even number of observations, the middle value is the average of the two middle values; that is, Q3 = (12 + 14)/2 or Q3 = 13. The interquartile range is Q3 minus Q1, so IQR = 13 – 7 = 6.