All data varies if properly collected from a random distribution. Dispersion is an important measure of process variation and a determinant of the predictability of your process. So, how do you measure dispersion?
Overview: What is dispersion?
In statistics, dispersion is a way of describing how scattered, spread out or variable a set of data is around some central tendency. When dispersion is a large value, it means the data is widely scattered. When it is small, the values are tightly clustered.
The dispersion of a data set is usually described by four descriptive statistics; range, variance, standard deviation, and interquartile range. Dispersion can also be shown in graphs such as; dot plots, box plots, histograms and stem and leaf plots.
Here is a little more information on the four measures of dispersion.
- Range – the difference between the maximum and minimum values in a data set.
- Variance – is the average of the squared differences between each data point and the average of all the data points. It can be used for both population as well as sample data and represents the dispersion of the data around the mean of all the data.
- Standard deviation – is the square root of the variance.
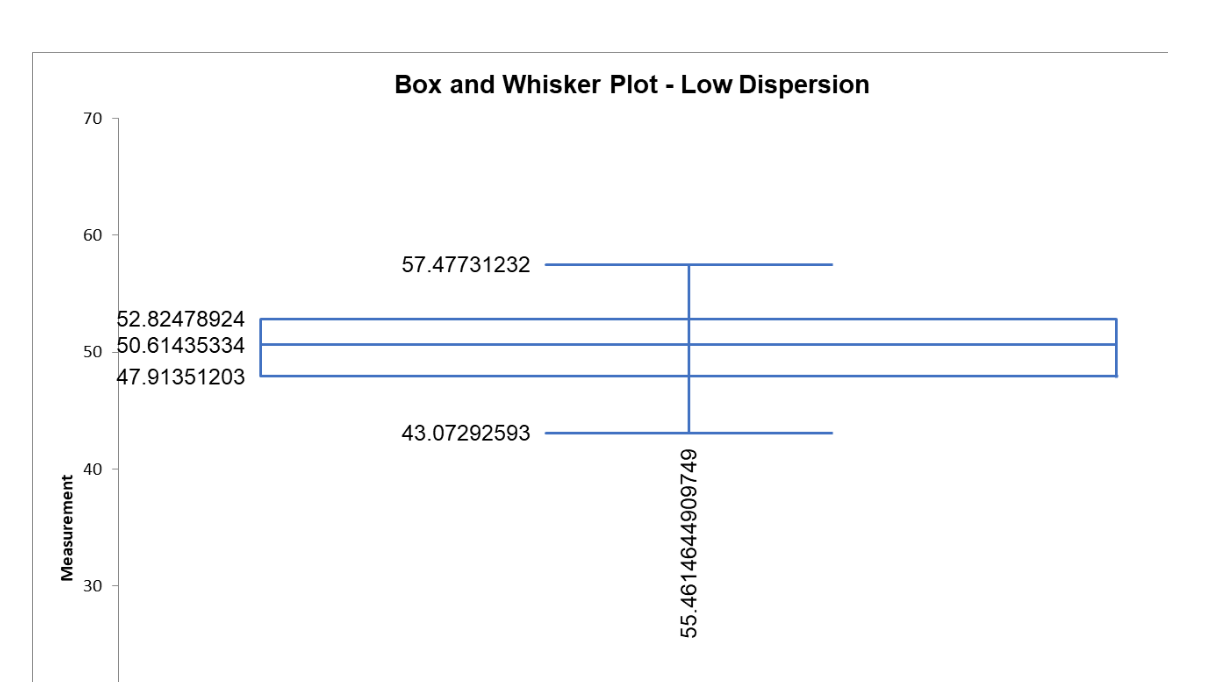
- Interquartile range – is defined as the mathematical difference between the third (75th percentile) and first (25th percentile) quartiles of the data. This will represent 50% of your data.
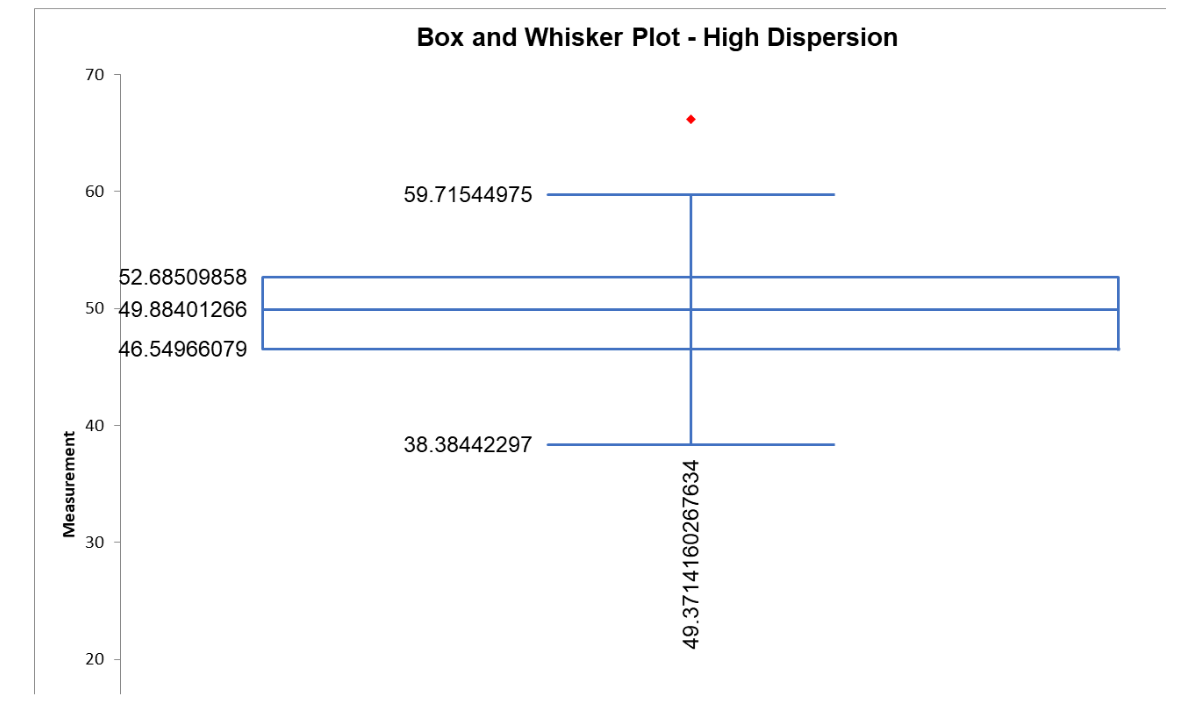
An industry example of dispersion
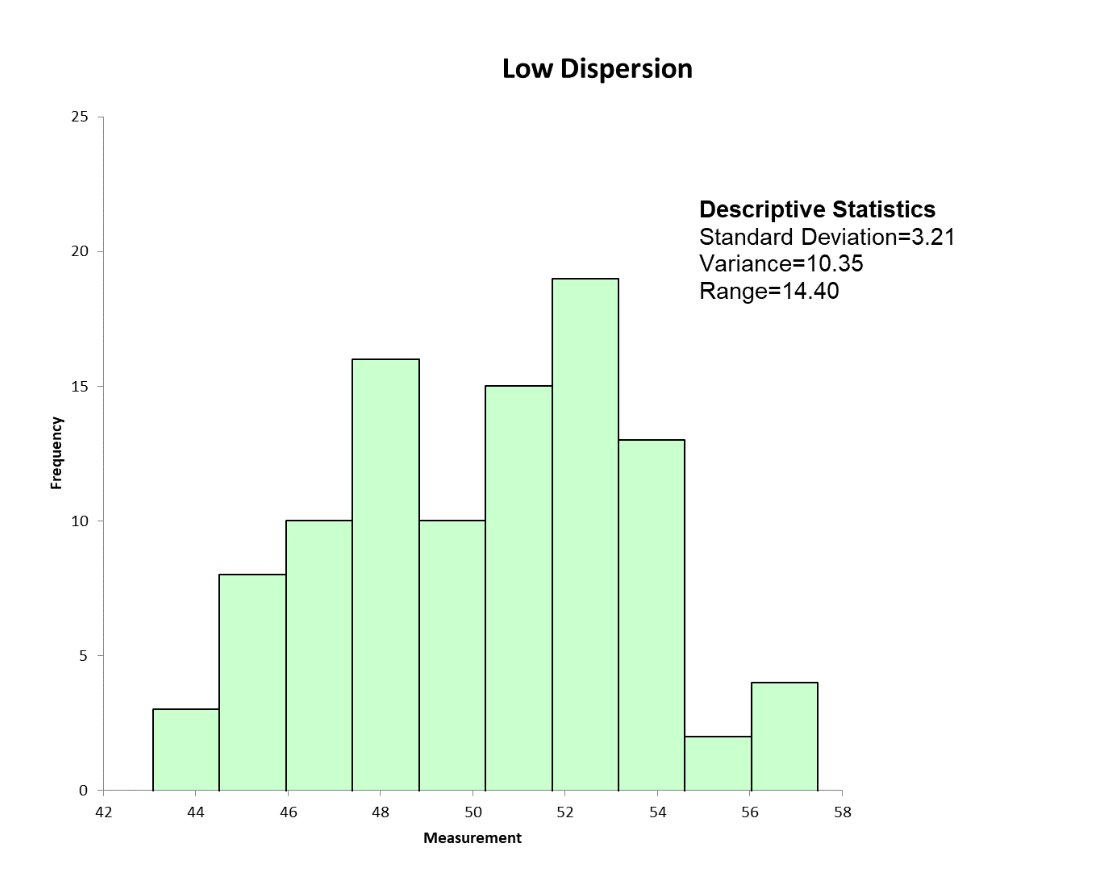
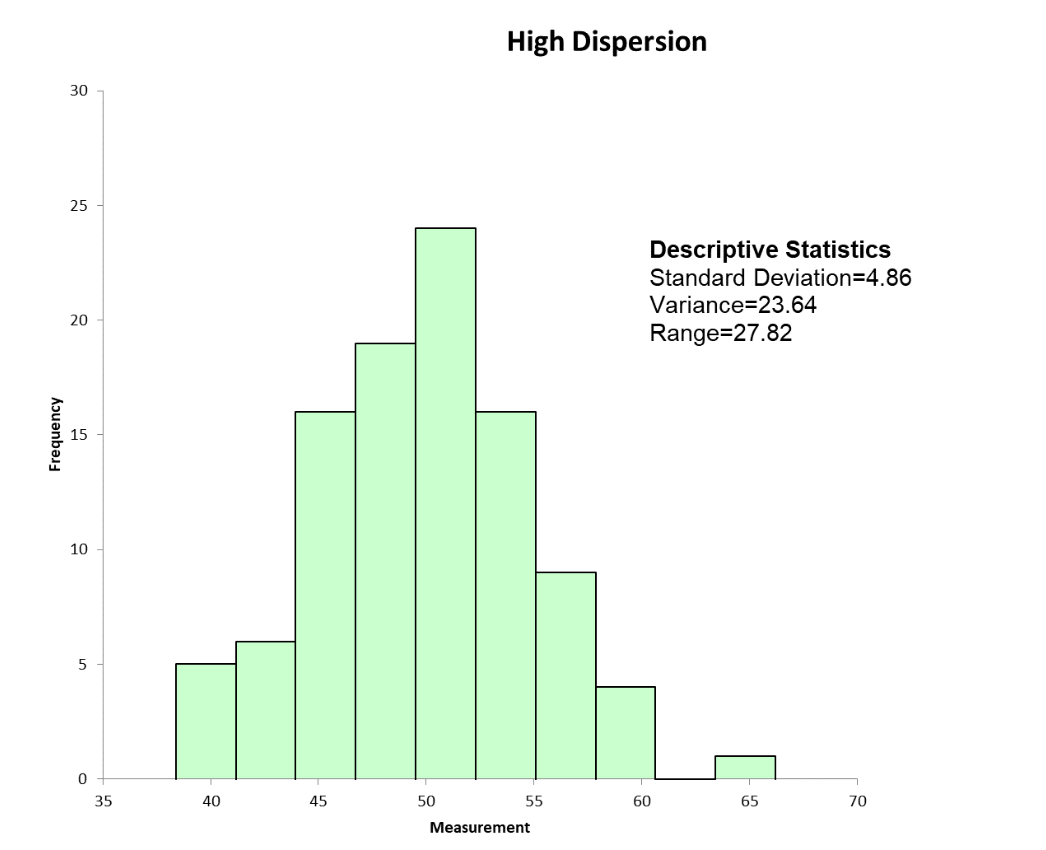
Below are the statistical and graphical output of dispersion for a set of machine turnaround data.
Frequently Asked Questions (FAQ) about dispersion
What are the four most common measures of dispersion?
The four are range, variance, standard deviation and interquartile range (IQR).
Are there simple graphs that can show the dispersion of my data?
Yes, you can use dot plots, box plots, histograms and stem and leaf plots to visually represent the dispersion of your data.
Why is understanding the dispersion of my data important?
If your process is very variable and has a wide dispersion, it is more difficult to predict how your process will perform compared to a process with a small dispersion and less variation.