
Key Points
- A t-statistic is performed during a t-test.
- The resulting statistic is used to determine whether to accept or reject a null hypothesis.
- The core use of this statistic is for direct comparison between two samples to check their differences.
The t-statistic is a calculation performed during a t-test to determine if you should reject your null hypothesis. You can use a t-test to determine if your population is different from some value of interest or whether two samples come from different populations.
Overview: What Is a T-Statistic?
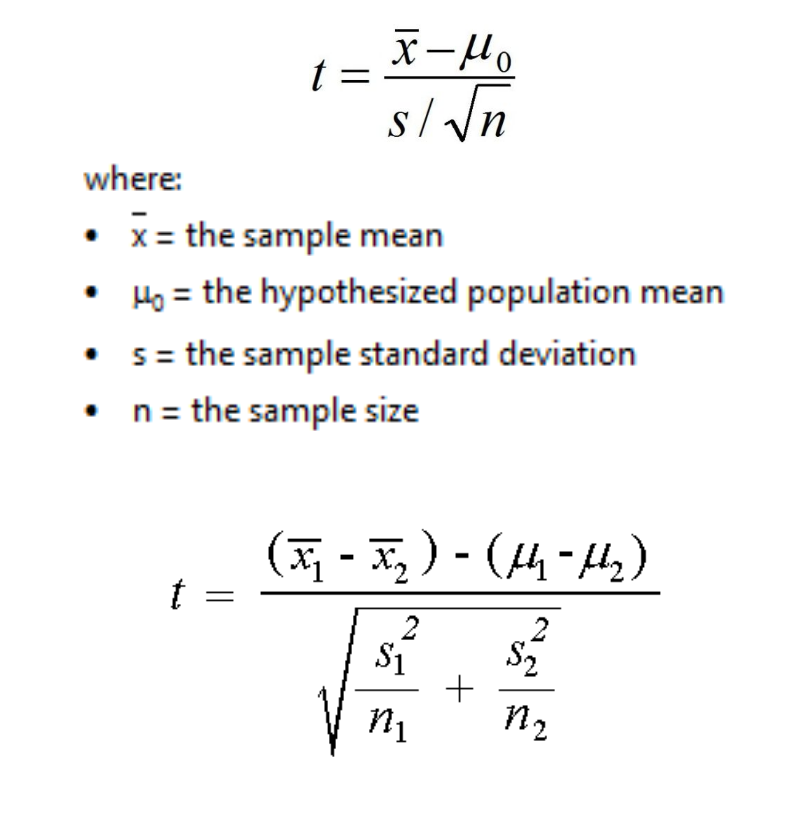
The t statistic is used in the context of a t-test when doing hypothesis testing. Hypothesis tests start with a null hypothesis (Ho) which states there is no statistically significant difference. An alternative hypothesis (Ha) states there is a statistically significant difference. A one-sample t-test can be used to determine whether your sample comes from a population that is different from some specific value of interest. A 2-sample t-test helps you determine whether two groups of samples are different and whether they come from the same or different populations.
The t-test is used when you have small sample sizes or don’t know the standard deviation of the population. The t-statistics for the 1-sample and 2-sample t-tests are shown below.
Why It Matters
You’re likely going to be running t-tests throughout your statistical analysis. As such, having the t-statistic on hand gives you exactly what you need to prove or reject your null hypothesis for a given test. Paying close attention to this metric is key for conducting better hypothesis tests as a whole.
An Industry Example of a T-Statistic
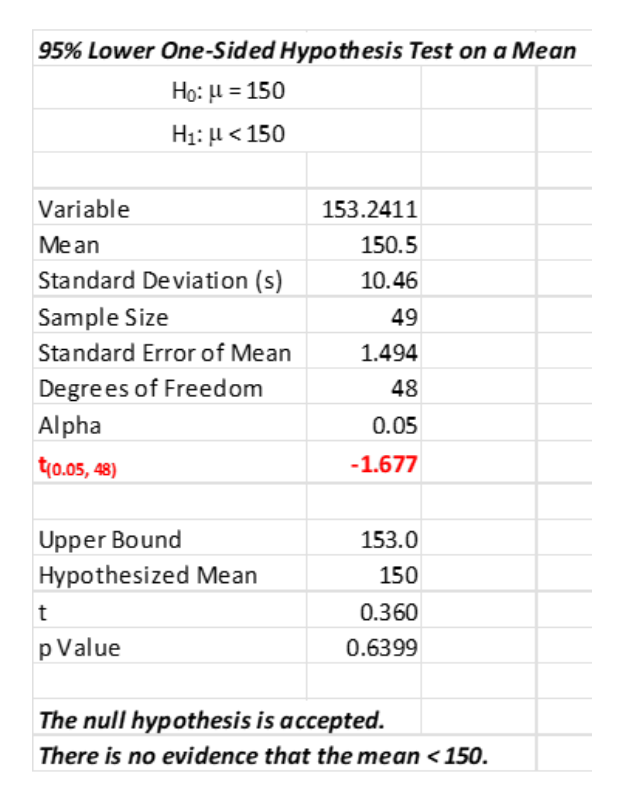
The vendor of a newly installed filling machine guaranteed the customer that the new machine would fill/cap/label and pack an average of 150 bottles per minute. The customer’s engineer ran 50 one-minute tests over a week.
He used a one-sample t-test to see whether the vendor was delivering as promised. The results of the t-test are shown below. Note the t value for the t statistic was relatively small (-1.677)l with an accompanying high p-value (0.6399). The engineer concluded the average fill rate was not less than 150 bottles per hour.
Other Useful Tools and Concepts
If you’re looking for extra tools in your hypothesis testing, you’re in luck. Learning how to make the most two-sample t-tests is a key part of any statistical analysis. Our guide covering the subject goes over how they work and the best practices for them.
Additionally, understanding the concept of normality in data analysis is paramount for newcomers. Normality has a few different definitions, but in the context of statistics, there is only one you need to use.