
This consumer products company has a large portfolio of products. Working with key customers, the company develops and promotes brand marketing programs to help the customer improve their sales which increases the company’s revenue as well.
The CEO of the company realized the percentage of successful promotions was less than he expected. At the same time, customer satisfaction with the marketing promotions and initiatives was declining due to missed deadlines and misalignment with internal customer promotions. As a result, he formed a large improvement team of senior leaders to address the problems.
Long cycle times + misalignment with customers = lost money and increased customer dissatisfaction
The company is a nationally recognized leader in the beverage business. Major customers include large, midsize and small national and regional grocery businesses as well as fast food restaurants. The company’s marketing function worked closely with the large and midsize customers to design and execute brand initiatives to increase revenue both for the customer as well as the company.
After personally receiving an increased number of complaints from key customers, the CEO investigated further. He found that the commercial support organizations were disjointed, overlapped with each other and competed with each other’s strategies and priorities. Since the company had deployed an organization-wide Lean Six Sigma effort, he chose to form a cross functional improvement team with himself as the Champion and the team members being the senior most leaders of the organization. Three senior Master Black Belts (MBB) were assigned to facilitate and drive the project.
The team size consisted of a core of 25 senior leaders with additional team members coming and going based on the needs of the team for additional insights and information. Since the commercialization selling process was very extensive, the project was divided into three sub projects, each facilitated by one of the MBBs. The area of major concern and focus was the development of specific brand programs to be used by customers to promote a specific brand for a specific occasion.
For example, a program may be developed and executed for a cola during college football season. Another promotion may be developed for a different product for BBQ grilling during the Fourth of July. And another for Halloween. The programs would be promoted by the customer and company via TV, print media and other forms of communication.
After analyzing the past two year’s performance of customer programs, the following problems were identified:
- Many programs were never sold-in to the customer because of customer schedule conflicts
- Program materials were often late, so the program kickoffs were delayed and sometimes canceled because the program was no longer relevant. For example, having promotional materials for Halloween arrive at the customer stores after Halloween resulted in the customer canceling the promotion and all the materials discarded at the company’s expense.
- Conflict existed between Brand leadership and Sales leadership as to the priority of what to promote to the customer.
- Since customers also do their own internal promotions, the company was spending money and recommending a quantity of programs which the customer did not have the capacity to execute. This was a waste of time and money on the part of the company.
***
Starting with process mapping tools and Voice of the Customer (VOC) the team dove into analyzing the process.
The MBB suggested the first step for the team would be to visually describe what the current as-is process is for the development of a program. A SIPOC was created showing the extended process at the proverbial 35,000 foot view. The team’s SIPOC is shown below.
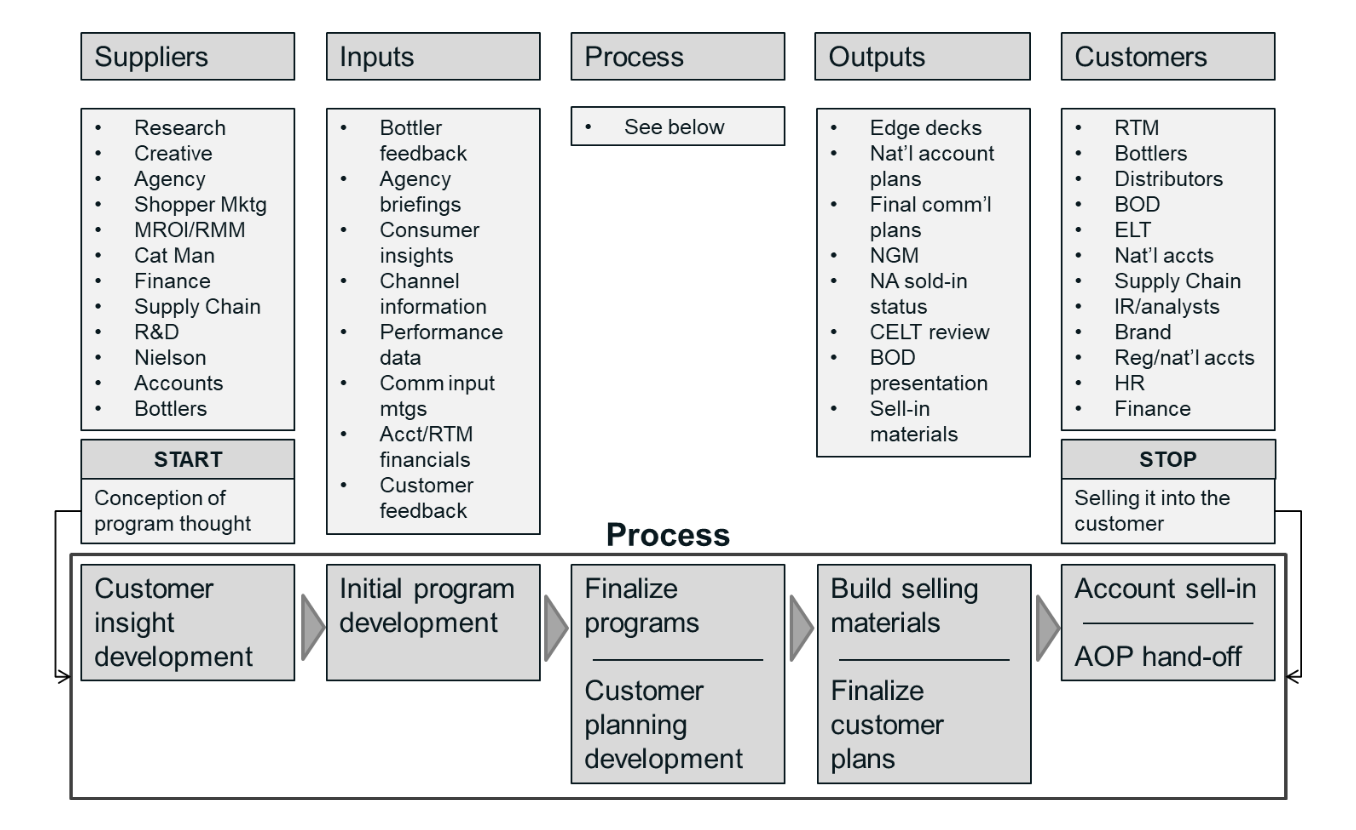
Each functional area was asked to provide all the tasks they perform in the process above. This was used later to do a value added/non value added analysis of the tasks.
The team decided the next logical step would be to get feedback directly from the customers of what they expect when deciding on a company recommended program. This was a little more complex than initially thought. First, the customer base was divided into large, midsize, convenience (drugstore/gas stations) and fast food. With input from Sales and Marketing, specific locations and people were selected to be interviewed.
Two person teams were selected to go visit the customer representatives and to administer a VOC survey. It was also decided to identify relevant internal company representatives and administer the survey to them. The intent was to compare what the customers actually thought with the perceptions of the internal company representatives.
The survey was designed as an open ended format to determine:
- What was important to the customer
- How they defined it
- How they measured it
- The relative importance of each
There were two additional questions about how well the customer thought the company was doing and how well the competition was doing on the same issues. A final question asked how many programs and promotions the customer feels they can handle in a year. Below is the format of the interview form given to the customer. A very similar one was used for internal people.
Question 1: When making a decision to use a XXX proposed marketing or sales program in your organization, what things do you consider important and what are your expectations of XXX and the program? (For example: types of sales materials, national and regional account planning and coordination etc.)
Question 2: Considering the items above in Question 1, can you please define what you specifically mean? How do you measure whether we are meeting your expectations? What are your goals or targets?
Question 3: Considering your answers to Question 1, please prioritize your expectations ranking them 1-7 with 1 being the Most Important.
Question 4: Considering your responses to Question 1, how well do you think XXX is doing? Use a scale of 1-5 with 5 being Excellent and 1 being Poor.
Question 5: Considering your responses to Question 1, how well do you think our competitors are doing? Use a scale of 1-5 with 5 being Excellent and 1 being Poor.
Question 6: How many XXX marketing programs or initiatives can your organization effectively implement on a yearly basis?
It took 2 weeks to collect all the responses. The survey responses were consolidated and analyzed. The team reviewed all the verbatim responses and wrote them on 3×5 index cards. An Affinity Diagram was created by the team to determine whether there was a pattern or series of themes resulting from the 250 individual responses on the cards. Fifteen distinct themes were identified.
***
Although the process was time consuming, the team gained tremendous insights into the disparity between what the company thought the customer wanted and what the customer actually wanted
Although the senior leaders had been Champions of many projects in their own functional areas, this was the first time they served as team members. The senior MBBs were challenged to keep the senior leaders focused and on task. The good news was the leaders had a new appreciation for the work their functional teams had done and the difficulty of completing their projects in a timely manner and reaping the benefits of their efforts.
Although the CEO was very disappointed in the results of the survey, he was happy his senior leadership now understood how the Six Sigma effort works and their role in leading it
The MBBs put together a PowerPoint deck to present the results of the survey and to make recommendations as to next steps. The first page of the presentation clearly showed the disparity between what the company people thought was important to the customer and what the customer people thought was important to them.
Below is the summary graphic of the 15 themes between the internal and external survey responses. Make a special note of the fact that the customer’s number one priority of Alignment was only number 5 for the company. Additionally, number 3 for the customer was number 8 for the company and number 4 for the customer was number 13 for the company.
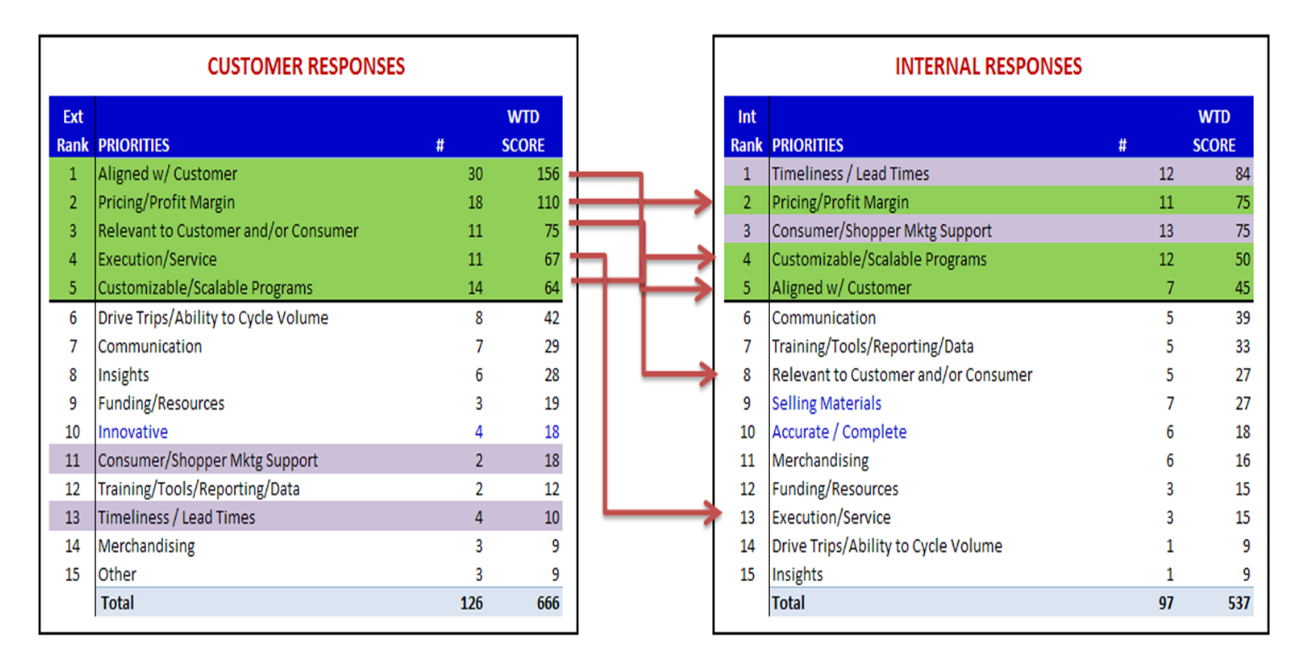
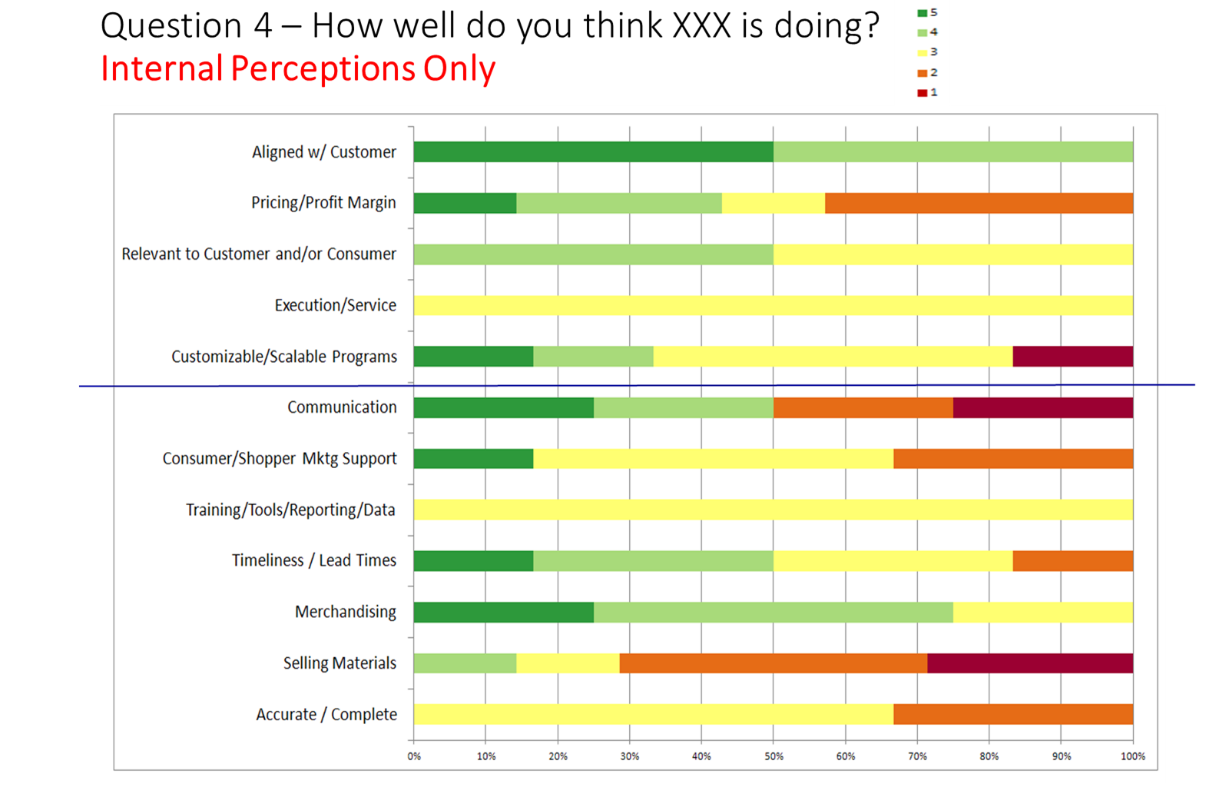
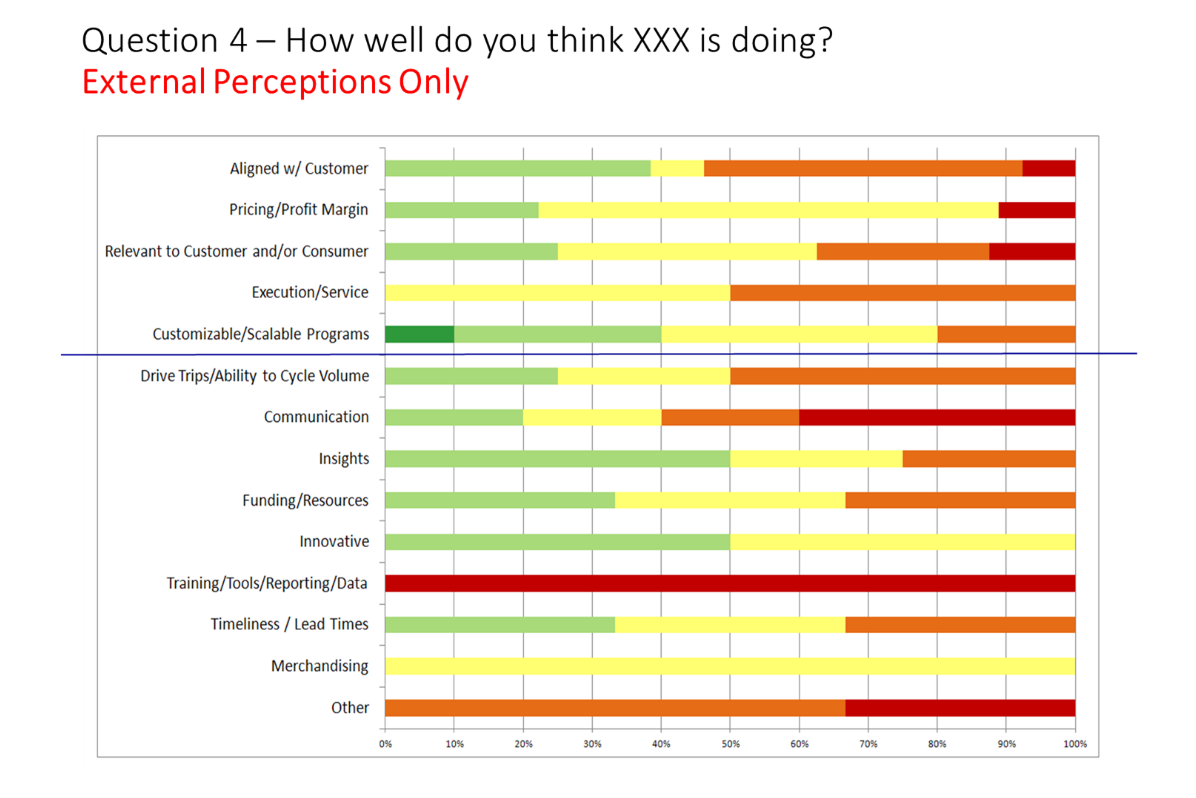
The above was consolidated from the first three questions of the survey. The CEO did not hesitate to express his concerns and disappointment about this result to his senior staff. The MBB making the presentation continued with the specific details and responses to the questions. He then proceeded to present the results of how well the customer thinks the company was doing and how well the company thinks they are doing. Again, note in the graphics below, the disparity between internal and customer responses. Red and orange are not the desired colors. The CEO let his feelings be known.
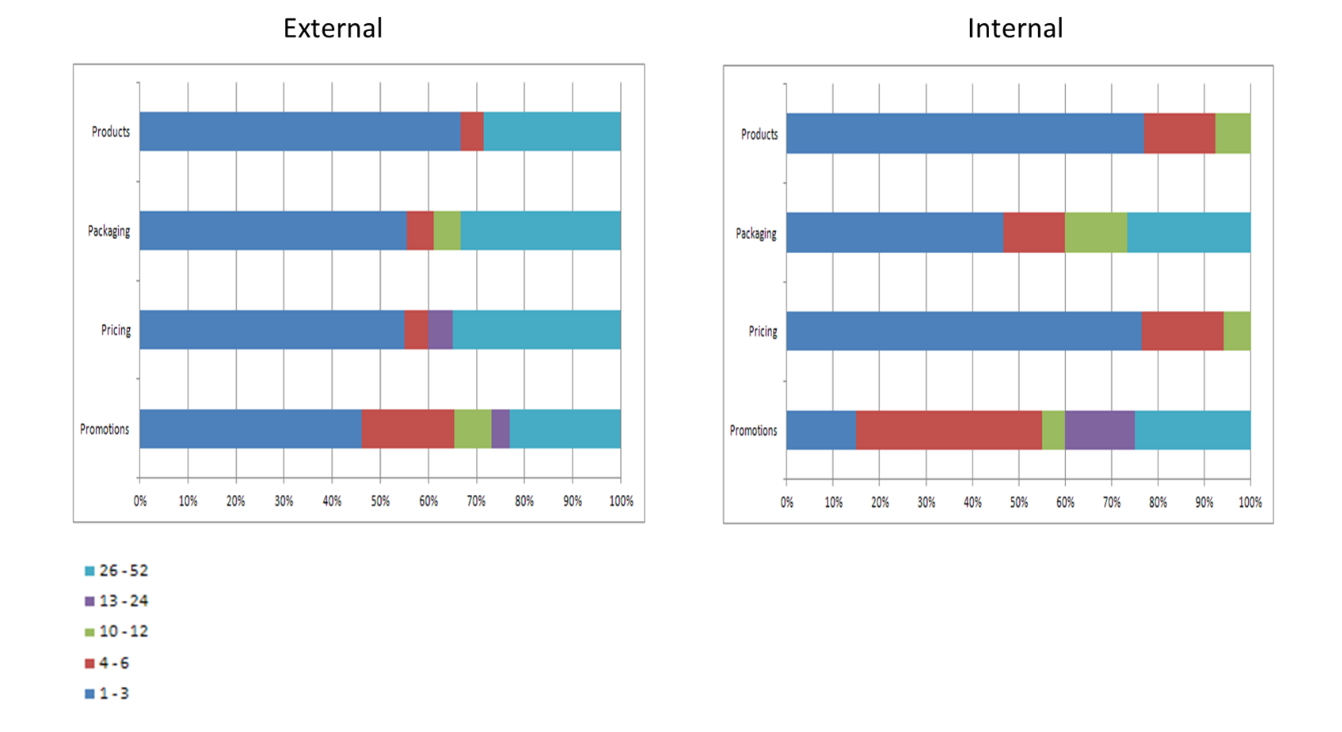
The last issue was the disparity between how many programs the customer felt they could handle versus what the company thought. You can see from the graphic below that the company was overly optimistic while the customer felt they were being overwhelmed by the volume of proposed programs.
Finally, the MBB presented the recommendations of the team for improving the process. A detailed Value Stream Map (VSM) showed the new proposed process incorporating ideas from customers which came from meetings between the company and the customer after the survey results were reviewed.
Resources were rebalanced to focus on other issues rather than solely on the creation of programs. A concerted effort was made to discuss the alignment of scheduled customer internal calendars with the company’s calendars thereby reducing conflicts. The number of programs that were sold-in were reduced but promotional materials were now 100% on time so the effectiveness of the programs were maximized.
The forecasted lift in sales was estimated at $10,000,000 in incremental revenue. An unexpected benefit was the elimination of a yearly Sales and Marketing meeting which saved $1,000,000. Since much of the work was now being done in the field directly with the customers, there was no need for the meeting.
3 best practices when aligning your company with the needs and expectations of your customers
This company’s experiences were not unique. Many companies believe they know what their customers really need. That belief can get you in a lot of trouble. Here are a few tips to prevent what happened to this company.
1. Get Voice of the Customer (VOC)
Not only do you want to know what is important to your customer, but you also must know how they define their needs and expectations as well as measure them. Having your customer prioritize what is important to them will keep you from working on things that are of lesser value to your customer.
2. Do a reality check on the perceptual differences between your company and that of your customers
Once you have your VOC, find out whether your internal perceptions are aligned or totally different than what your customers think. This is usually an eye opener.
3. Map your processes
One of the first things you should do is map the current state of your processes. Those activities or tasks that are not value added in the eyes of the customer should be considered for change or elimination.
Achieving a win-win situation for everyone
One of the biggest mistakes a company can make is assuming they know what their customers want and need. It is not too difficult to directly ask your customer using some simple survey techniques. Open-ended questions are often better for eliciting open, honest and more insightful information. Testing whether your internal people are aligned with your customers’ perceptions can be game changing.
Because you have not gotten direct feedback from your customer, your processes may be designed based on false perceptions of what they want. As a first step, map your current processes. Once you have gathered your VOC, you can compare what you are doing with what you should be doing. This will allow you to improve your process and your overall organization.