
Speaker programs are company-sponsored events where physicians or other healthcare professionals make presentations to other physicians or healthcare professionals about a drug, device product, or disease state on behalf of the company. The company generally pays the speakers an honorarium, and attendees often receive some benefits such as free meals.
In this format, physicians, who are familiar with the product, are selected to serve as spokespersons for the company. The speaker is scheduled, the program is developed, relevant people are invited and the program is delivered. There are administrative costs as well as speaker honorariums and expenses. Let’s learn more about what the company’s problem was and how they saved almost $1,000,000.
It cost money, unhappy attendees and dissatisfaction of the speaker faculty when a program was canceled.
This U.S.-based pharmaceutical company produced a large portfolio of drugs for conditions in the neurosciences such as depression, ADHD, schizophrenia and bipolar.The annual promotional spend on speaker programs was approximately $8M. This covered the logistics and expenses of the programs along with the physician honorarium and their expenses.
These programs are sponsored and paid for by the Neuroscience sales force. After reviewing program data, two issues came into focus. The first issue was the frequency of cancellations of a program. The data showed that many of the cancellations were due to logistical failures on the part of the company. The overall rate of cancellations was approximately 20%. This amounted to an annual cost of about $1,400,000.
Besides the dollar expense of cancellations, there were other issues to contend with. One was the dissatisfaction of the attendees who had already made their travel arrangements and set the time aside in their schedules. Another problem was the dissatisfaction of the speaker faculty who sometimes lost the income from their honorarium and had to cancel their travel arrangements. Because many of the cancellations occurred after an agreed upon cutoff date, speakers still received their honorarium despite not having to deliver the program.
A final question the data attempted to answer was whether the programs had any real value to the attendees. A review of the surveys handed out at the end of the program indicated the program participant was seeing value in most of the presentations.
Before seeking to try and improve the process to reduce cancellations, the root cause and true reason for cancellations needed to be determined. Once a decision was made to cancel a program, the sales representative handling the specific program had to report out the reason for the cancellation and the implications and costs of the cancellation. Since a cancellation might be a negative reflection upon the sales rep, the company questioned whether the self reported reason accurately reflected the true reason for the cancellation.
Bob, one of the company’s Six Sigma Black Belts, was asked to form a team and improve the process. After reviewing the cancellation forms for the past year, Bob thought he knew the best statistical tool to use to determine whether the reported reasons for cancellation were consistent and accurate.
Bob decided that an Attribute Agreement Analysis was what he wanted to use to determine the accuracy and consistency of the measurement system.
Attribute Agreement Analysis is used to evaluate the agreement between the ratings made by multiple people and a known standard. You can use Attribute Agreement Analysis to determine the accuracy of the assessments made by multiple people and to identify which items have the highest misclassifications. Attribute Agreement Analysis can be used to evaluate the agreement of subjective nominal or ordinal ratings.
The Attribute Agreement Analysis study can be set up in much the same way as a regular Gauge R&R study. A number of items are selected from the process, and are assessed by two or more people. It will be possible from the study to determine how consistent the people are within their own assessments, as well as the degree of consistency between people. If it is possible to set a standard for the assessment of each item, then the performance of each person can also be compared to the standard.
Attribute data are subjective ratings by appraisers instead of direct physical measurements. For our story, the sales rep can evaluate reasons for program cancellations as nominal data using such categories as; not enough attendees signed up, speaker canceled because of a conflict, venue canceled, presentation materials not ready on time, negative publicity about the drug, or other.
Initially, Bob used the existing data to do a Pareto Chart of the causes recorded in the sales rep cancellation forms. This is what it looked like:
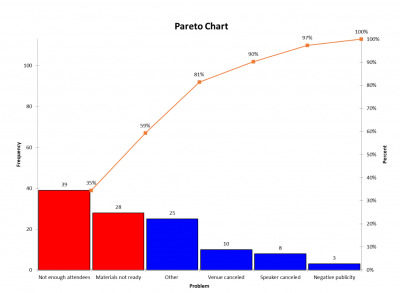
As you can see, 35% of the program cancellations were due to not enough attendees signing up with 24% due to presentation materials not being ready. Curiously, 22% of the cancellations were due to Other. This was disconcerting to Bob since there was apparently no specific reason provided for the cancellations. Either the sales reps are just checking it off in the hopes no one will question them or more categories of reasons need to be provided on the cancellation form.
Bob, with the help of the team, designed the study to see if there was sufficient accuracy and consistency in how sales reps define the reasons for cancellation. To do that, this was the process they used:
- Five sales reps were randomly chosen from the Neuroscience sales team. They all had similar backgrounds and levels of experience.
- Fifty scenarios were developed by the director and manager of the sales team describing the circumstances of the program. The scenarios were reflective of the six reasons for cancellation. Since they were writing the scenarios, they knew the correct reason the sales rep should select.
- Each sales rep was asked to read the 50 scenarios and select the reason they thought each program was canceled.
- A week later, the 50 scenarios were randomized from the original sequence and read again by the sales reps and the reasons selected.
- Once everything was completed, Bob analyzed the results using a popular Excel based statistical software package.
Bob explained to the team the reason for reading the scenarios twice and randomizing the order. He told them he wanted to do the readings twice to determine whether their responses were repeatable. That is, will each rep pick the same reason both times or will they be inconsistent. The purpose of the randomization was to eliminate any memory bias of the first reading versus the second.
Soon, you will see what Bob concluded about the sales reps’ process of selecting reasons for cancellation and whether they were accurate, repeatable and reproducible.
Things didn’t go as smoothly as Bob had hoped.
The first challenge Bob faced was to have the sales leadership write the 50 scenarios. Although the scenarios were short, it still took time to write 50 unique stories while providing sufficient details to allow the sales reps to accurately identify the most appropriate reason for cancellation.
The other major challenge Bob and the team faced was the time it took for the sales reps to do their two readings. Due to the length of time and the amount of reading, two of the sales reps found themselves drifting and losing focus. This slowed the process down and raised the question of whether their responses really represented their true opinions. Eventually, everything was completed and Bob did his analysis.
There was good news and bad news in Bob’s analysis.
When analyzing an Attribute Agreement Analysis, there are three outcomes you are seeking to understand. First, is the sales rep repeatable and selects the same reason for each scenario the first and second time they read them. While not each of the 5 sales reps had perfect repeatability, their results were high enough to show the measurement system is capable of being consistent with respect to an individual sales rep.
The second characteristic Bob was seeking to understand was the reproducibility of the measurement system. This describes whether all the sales reps agree on the reason for the 50 scenarios. Again, while not perfect, most agreed on the reason for the cancellation.
The final characteristic is accuracy. The question is whether the sales reps came up with the same reasons the sales director and manager did when they wrote the scenarios. While the previous two outcomes were good news, this one was not. While the sales reps were consistent, they were consistently wrong. In other words, they agreed with themselves and others on the reasons but did not consistently match the reasons the sales leadership selected.
When this situation arises, it is usually a result of poor operational definitions of the characteristics people are evaluating. Bob immediately recommended that sales leadership clarify and provide a better definition of the different reasons for cancellation. This would need to be shared with the sales reps. They also added a few more reasons to provide further granularity for those reps checking off the Other box.
Once the definitions were implemented, Bob collected more data on cancellations to be sure the correct reasons were being captured. The new data reinforced that not enough attendees and materials not ready were still the top two reasons. The difference was the results were now more believable and valid.
The team eventually developed specific actions the company could take to follow up and generate interest in their programs so more attendees signed up. They also re-evaluated the process for preparing program materials so they were ready 98% of the time. These two actions reduced cancellations saving approximately $975.000 in reduced cancellation expenses for the year.
An added benefit was the increased satisfaction and reduced frustration of the speaker faculty since the process now worked more smoothly and programs were not being canceled as often. Finally, attendee satisfaction increased on the surveys distributed at the end of a program.
3 Best Practices When Implementing an Attribute Agreement Analysis
There can be some challenges in doing an Attribute Agreement Analysis. Here are a few tips to help make it easier to execute.
1. Be sure your operational definitions are clear.
Since the Attribute Agreement Analysis, especially for nominal data, is based on a subjective evaluation of what you are measuring, be sure your operational definitions are clear and well defined. If not, your reproducibility may be affected because people will have different definitions in mind.
2. Randomize your trials.
You want to do multiple trials to determine the repeatability of the measurement system. To offset any memory bias, randomize the sequence which your participants use to evaluate what you are measuring.
3. Select the right number of people, items and trials.
Depending on the situation, you might select; 5 to 10 people, 10 to 20 items and 2 to 3 trials. This is more of a judgment decision rather than an absolute, so be flexible.
The company had a reason to celebrate what Bob and the team accomplished.
Many of your business decisions rely on data and what it tells you about the process. But, you must have confidence the data came from a measurement system capable of producing valid and trustworthy data. This was not the case with this company as it explored the reasons for program cancellations.
Once Bob and the team did the Attribute Agreement Analysis, the true reasons for the cancellations became more believeable. Since the major reasons were in the control of the company it was just a matter of making some process changes to significantly reduce program cancellations. This resulted in the elimination of approximately $975,000 in needless costs. That’s worthy of celebration.