
All Lean tools follow a common philosophy: Do it right the first time. Eliminating waste (or muda in Japanese) from your processes is essential to maximizing profit. Value stream mapping (VSM) is a tool for finding and eliminating these wastes (transportation, inventory, motion, waiting, overproduction, overprocessing, defects, skills).
VSM is also known as material- and information-flow mapping, as it illustrates the relationship between work processes and clearly indicates where the process is having problems. There is a power to using this visual tool to represent your process. VSM provides you with an end-to-end overview of the process (i.e., from the beginning of that process until it reaches the customer), highlighting details such as who is involved in the process, what process is taking place and how much time that process is taking.
Separating VA, NVA and NNVA Activities
Processes typically have three types of activities:
- Value adding (VA): The customer pays for the benefits they are receiving.
- Non-value adding (NVA): This activity is something a customer is not willing to pay for as it does not benefit them in any way.
- Necessary non-value adding (NNVA): Here, the processes are not creating value for the customer, but they are essential from a business point of view and therefore necessary to have them in your processes.
With the detailed breakdown provided by a VSM, you can segregate VA activities from NVA activities and work to eliminate the latter in order to increase the productivity of your process. VSM helps you identify the people involved in doing a particular process, and how much time is taken by a process and also between the execution of steps within the process.
The Look of a VSM
When working on a Lean project, a VSM helps you see where you can improvise and station your unused or misused resources to produce good work.
- The top section of a VSM consists of an answerable unit, which refers to the people who give orders and directs the actions throughout (e.g., supplier, manager, consumer). They tell you what they want, where they want and when they want it. Here is where the information flows.
- The mid-section comprises the end-to-end process by which you will produce the product – the process of picking up the raw material from XYZ supplier and delivering the final product to ABC customer. This is where the material flows.
- The bottom section consists of time taken for each and every process step (uptime) and time between two process steps (downtime). You will try to eliminate downtime as you also spend time distinguishing VA from NVA and also check for NNVA.
Example: Patient Turnaround Time in a Hospital
Let’s look at an example – patient turnaround time (PTAT) in a hospital – that shows the value of a VSM.
All hospitals conduct feedback in which patients (or their caregivers) discuss their experience when they come in to get seen/treated. Hospital ABC started receiving feedback saying it needed to improve PTAT, the time it takes for a patient to enter the facility, be treated and leave. The problems with PTAT have been so bad that they have seen a decline in the number of patients visiting the hospital. Those who do seek treatment at Hospital ABC have significant complaints about PTAT. The hospital wanted to promptly address PTAT before its problems worsened.
Data on the times patients spent in the various stages of their visits were collected and turned into a VSM. The figure below shows the process that is required for a patient to get diagnosed and the time required between steps.
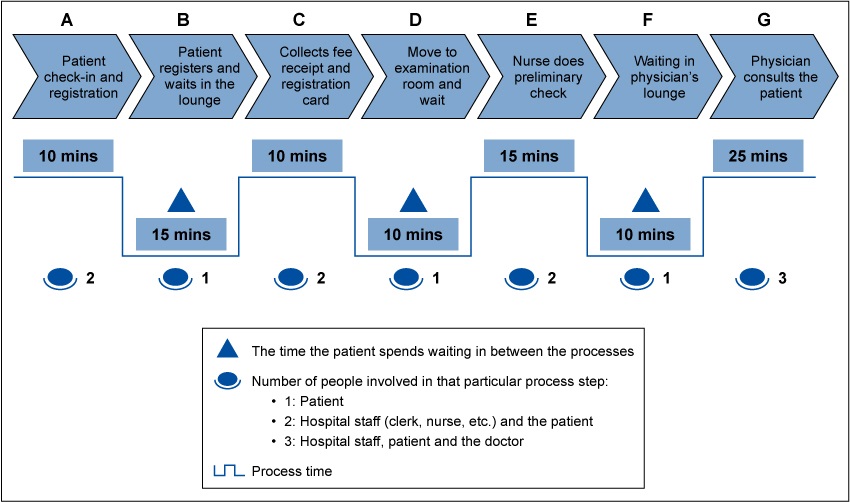
As shown in this example, the uptime (also known as process time) is: 10 + 10 + 15 + 25 = 70 minutes.
But the only VA steps are E and G, which equal 40 minutes of the total PTAT. Steps A and D are NNVA; the others are NVA.
The NVA steps, or downtime, equal 15 + 10 + 10 or 35 minutes. So how can Hospital ABC move forward from here? Start with the longest time taken in the process – physician consulting time. Obviously that time can’t be eliminated, but in many cases it may be reduced. Similarly, the preliminary exams with nurses can’t be eliminated, but that time may be reducible in some cases.
Wait times, however, might be able to be systemically reduced. The waiting time in the lounge is 15 minutes and it can be eliminated. As soon as the patient registers, they can move on – Steps B and C can be done away with. This alone will save 25 minutes.
Once the patient registers and pays, they still have to wait in the examination room. But the wait time for the doctor can be reduced if the nurse is in an adjacent room as to that of the physician. Once the nurse’s preliminary exam is complete, the patient can move directly to the doctor’s consultation room. This will save about 10 minutes, reducing the wait time from 25 minutes to 15 minutes.
With just a few changes, Hospital ABC would have a new PTAT of 40 minutes – 30 minutes less than the original PTAT.
Value a VSM
Although this example shows an idealized vision of the potential for time savings, it is clear that creating a VSM allows anyone to thoroughly understand a full process. A VSM highlights VA steps in the process. Once those steps are identified, the hang-ups in the system can be removed or reduced to ensure that your process is as efficient – and profitable – as possible.