
Key Points
- Trend analysis is a method of using data to spot patterns for the sake of forecasting future events.
- There are many tools to conduct trend analysis.
- Given the proliferation of modern software, it is relatively easy for anyone to conduct trend analysis.
If you could somehow predict the future, you might be able to plan better and make your organization more successful. This article will explore three statistical tools for doing trend analysis, how they work, their benefits, and how your organization can apply them.
What Is Trend Analysis?
Trend analysis is the use of past data to spot patterns, so you can better predict and forecast what the future will look like. While there are many tools and approaches you can use for trend analysis, we will focus on three common statistical methods for doing it. The three tools are control charts, regression, and time series analysis.
Let’s start with control charts.
Control Chart
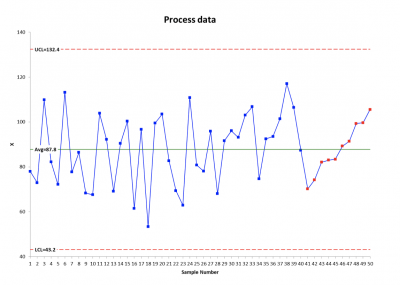
The control chart is a graphical representation of your process data over time. Data is gathered either individually or in subgroups. Calculations are made of the mean and range or standard deviation and then plotted on a graph. Control limits are calculated from the data and depict the expected variation of the process over time.
While there is variation in every process, some may be considered common causes resulting from the natural variation of the process factors, or special causes due to some unexpected occurrence.
When interpreting the control chart…
- You will look for signals of special cause variation so you can investigate and either eliminate the cause if it negatively impacts the process or incorporate it if it improves the process.
- You will also look for patterns and trends. These patterns can be shifts in the process average and/or changes in the variation due to increases or decreases in the range or standard deviation.
- You may also look for data points trending up or down in a significant manner. There are a number of rules used for interpreting control chart patterns that were developed by a group of engineers at Western Electric.
Below is a control chart exhibiting an upward trend, which, in this case, is bad. This should be investigated and the root cause acted upon as appropriate. If not, the trend will likely continue.
Regression
The second tool you can use for trend analysis is regression. This will allow you to observe the relationship between a process variable and time. You can look for a simple linear relationship or a more complex non-linear one.
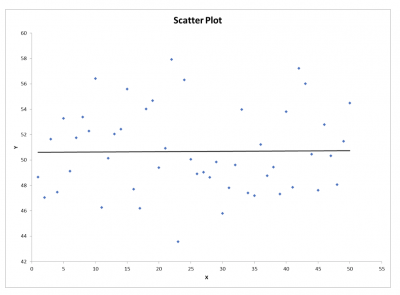
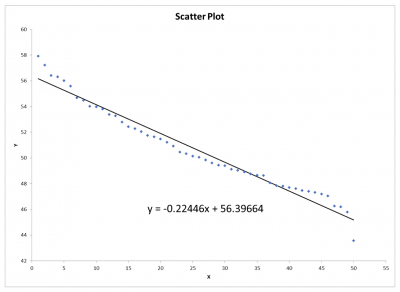
Data is collected and plotted on an X-Y chart often referred to as a scatter diagram or plot. If your process is changing over time, you will be able to visually see that. Additionally, you can do some calculations and develop a prediction equation that will estimate the value of your process data for a specific period.
Below is an example of a scatter plot with no trend and one with a downward trend. The formula in the second graph can be used to predict values for the trend.
Time Series Analysis
The final tool for trend analysis discussed in this article will be time series. This tool is based on the concept of looking for patterns in the data and then extrapolating those patterns into the future.
While regression is useful for examining simple relationships and looking for trends, its downside is the inability to extrapolate much beyond the existing values used in the analysis. This is called intrapolation. On the other hand, the calculations used for time series allow for extrapolation for the future based on the historical data.
Time series is a form of regression modeling with the difference of allowing future predictions or extrapolation. With time series analysis, you can analyze the future for trends and seasonality. The calculations use a variety of weighting, giving the most recent data values more importance than previous data.
The key is to match the correct method of analysis with the patterns. When extrapolating a pattern into the future, you must have a basis for believing that the predicted pattern will occur and that conditions won’t significantly change.
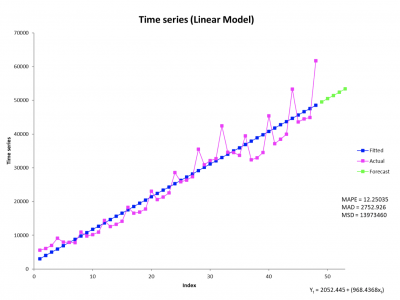
The graph below shows how a trend would be forecast by time series using double exponential smoothing. The green diamonds are the forecasts, and the purple triangles are the relative uncertainty of the forecast in the future.
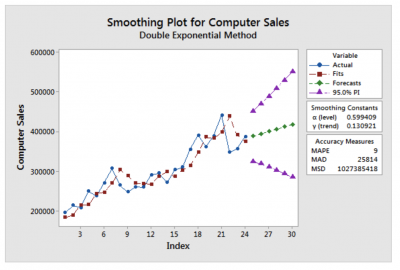
Time series analysis for trend
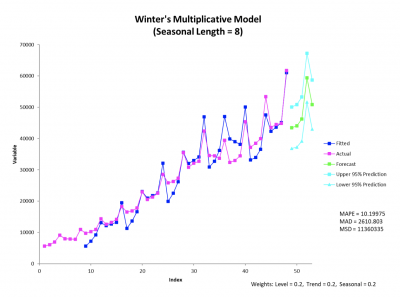
The graph below shows how trend analysis would forecast and predict both trend and seasonality.

Time series analysis for trend and seasonality
Why It Matters
We can’t see into the future. If we could, the fortunes of many organizations would be very different. However, by utilizing the tools we do have, we can better prepare ourselves for what comes next. Trend analysis is just one piece of the puzzle when it comes to adapting to what the future holds.
Benefits of Trend Analysis
The ability to predict enhances your ability to plan. The benefits of trend analysis are the key to your ability to predict.
Simplicity and Availability
Given the sophistication of today’s statistical software, the calculations and display of your trend analysis are relatively simple.
Flexibility
Trend analysis can be done for forecasting level processes, trends, and seasonality.
Planning
Assuming your trend analysis is relatively accurate, you will be able to plan for future resources, capital expenditures, personnel, cash flow, etc.
Why Is Trend Analysis Important to Understand?
Given the number of techniques available to do trend analysis, you should understand which one to use and any limitations of its use.
Constraints
The use of regression for trend analysis is common. The problem is that any regression forecasts need to be limited to the boundaries of the existing data. Extrapolating beyond the time frame of your data is not advisable and accuracy becomes dubious. Time series doesn’t have the same limitation.
Which Smoothing Elements to Use
The accuracy of your analysis will be dependent on the proper use of statistics. The weighting factor, alpha, as well as your choice of smoothing methodology is important to understand to achieve the best and most accurate forecasts.
Sample Size
To properly estimate the future, you will need adequate sample sizes to accurately identify trends.
An Industry Example
The vice president of sales was doing some strategic planning for one of his top products. He had approximately four years of monthly sales data. To help plan for short-term sales revenue, he decided to do some trend analysis using time series analysis.
He first attempted to use a simple linear trend. While there was an upward trend in sales, the graph indicated there might also be some seasonality to his sales. As a result, he ran the analysis using Winter’s Multiplicative Model. Based on the lower value for the Mean Absolute Percentage Error (MAPE), it was concluded that Winter’s model provided a better forecast and included an analysis of the trend and the seasonality.
Trend Analysis Best Practices
While your computer and statistical software make it easy for you to do the calculations and create charts, there are a few less technical things you should consider.
Measurement System
With trend analysis, you are predicting the future based on your historical data. You must have confidence that you can trust your data. Do a Measurement System Analysis (MSA) study before relying too heavily on your existing or future data.
Experiment
Run your analysis using different approaches and assumptions to see if one is better than the other for producing accurate and reliable estimates of the future.
Confirm
Use interim confirmations that your methodology is producing believable forecasts. Continue to refine and revise your analysis as more information becomes available.
Other Useful Tools and Concepts
So, I hope you’re still hungry for more. You might want to look into how quality management allows you to maintain an overall higher grade of deliverables when compared to your competitors. This is a comprehensive approach that goes through every possible nook and cranny in your organization.
Further, you might want to learn about how to streamline Six Sigma projects with the 7 QC tools. These useful tools should be part of any project, and readily allow users to get down to the cause of any potential issues that arise.
Conclusion
Trend analysis is a strategy that uses patterns inherent in historical data to make future predictions. You can use control charts, regression, and time series tools to accomplish this.
Your predictions become critical in helping you plan for the future. The accuracy of the predictions will depend upon several factors such as sample size, statistical assumptions, errors, and whether the underlying process is chaotic and changing.