
Enterprise risk management (ERM), a framework for managing risk across an organization, improves an organization’s ability to accept the right amount of risk to capture strategic opportunities. ERM is made up of eight components, each of which can be supported by the tools and methods of Six Sigma.
1. Internal Environment
The business vision, coupled with leadership’s personal examples, determines the values of the organization and the behaviors of its workers. This organizational culture establishes employees’ receptivity to change. Equal attention must be focused on the people side of change, as well as the tactical tools of process change.
The behaviors, attributes, ethical values and integrity of the process workers all contribute to their perceptions regarding risk and controls. Likewise, their view of their level of authority and responsibility – along with organizational commitment to human capital development – all have an effect on commitment levels and compliance risk management. Using Six Sigma change management tools can aid in creating this type of culture that looks on process improvement in a positive light.
2. Objective Setting
Enterprise objectives are established at the strategic level and translated into granular objectives at the business unit level. Traditionally, these objectives have been financial ones, which has led to behaviors that optimize performance of the business unit at the expense of the enterprise, both from the financial and risk perspectives. A trend in process improvement is emerging, however, in which organizations directly link these objectives to the voice of the customer (VOC), voice of the business (VOB) and voice of the regulator (VOR), providing a more realistic measure of organizational performance.
An ERM framework has three broad categories of related objectives aligned with and supporting the selected strategy of the enterprise:
Operational objectives relate to the effectiveness and efficiency of the enterprise’s operations. They have historically been financial in nature and have not been truly indicative of the waste that typically occurs within the organization.
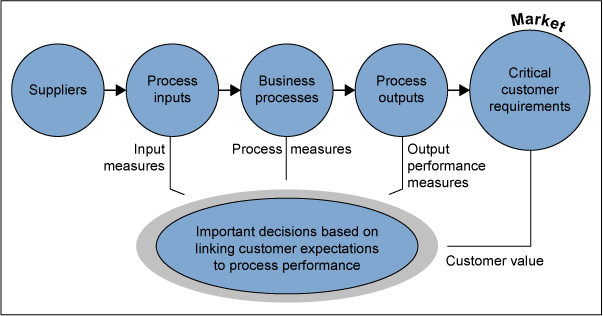
Figure 1 illustrates the relationship between the output indicators, those that the market may use to compare an organization to its competitors, to the process indicators that more accurately predict the performance capabilities of the processes. An organization’s ability to monitor and measure the upstream activities that contribute to the variability of its products or services can differentiate it from its competitors, which may continue to rely on outcome measures or financial measures to gauge their performance.
Reporting objectives have been in the headlines recently with both internal and external reporting failures – excellent examples of the breakdowns that exist in ERM. These failures can be directly related to the internal environment component of risk management.
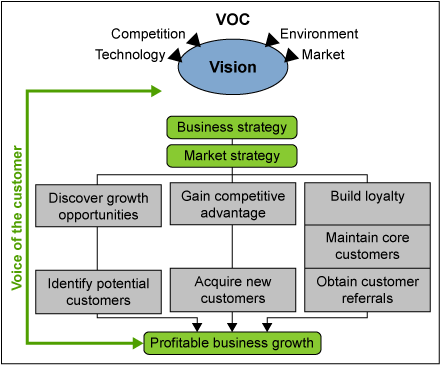
Employees are often rewarded for their contributions toward the financial success of their business unit. Unfortunately, their actions may have an adverse effect on the overall enterprise. Six Sigma tools coupled with stakeholder adoption and change management can shift the focus to the VOC and the voice of the process (VOP). There are several different opportunities to increase the value of the organization through top-line growth (Figure 2).
Compliance objectives rely on individual adherence to relative laws and regulations; however, employees’ behaviors can again be influenced by the internal environment established by leadership, coupled with the rewards and recognition system that drives those behaviors. The entity’s compliance record can significantly contribute to its reputation risk, either positively or negatively, in the marketplace.
3. Event Identification
Many basic Six Sigma tools can significantly assist leadership in managing this component of ERM. Using the tools can help practitioners:
- Provide insight into sources of potential failure events.
- Help determine opportunities to gather metrics that serve as both leading and lagging indicators.
- Apply statistical techniques to determine process capabilities that help establish escalation or threshold triggers.
- Highlight constraints that restrict the organization’s ability to meet production demand.
- Identify quality or service deficiencies.
Functional process flow analysis is used in most Six Sigma projects to document the as-is process. By applying Lean principles, processes are streamlined to eliminate waste and inefficiencies.
Performance metrics are established to indicate how well processes perform against the critical requirements of both the customer and the business. Process capability metrics and performance capability metrics serve as common measuring devices that leadership can use to prioritize resources to improve performance.
However, performance metrics are lagging indicators that measure outputs as seen by the customers of the process. Statistical tools can help quantify the relationship of process and input indicators collected upstream, which predict the performance of the process. These leading indicators can be statistically correlated to the output metrics, thus used as upstream predictors of process performance.
Process measures also provide an excellent source of information for identifying trends and root causes. Practitioners can use statistical techniques, such as hypothesis testing and design of experiments, to identify and quantify sources of variation in processes, and highlight the need for additional monitoring and controls in certain areas., These statistical techniques rely on the existence and accuracy of loss event data. Unfortunately, many organizations only recently have realized the need to establish these data repositories. Furthermore, tracking loss event data may not be enough. Organizations also must report rework and scrap.
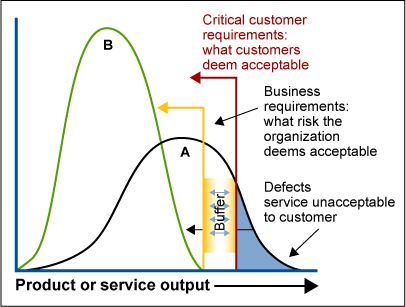
Once an organization has established the reliable collection of process metrics, statistical tools can be used to quantify and establish critical escalation or threshold triggers that prompt management to either quickly assess or respond to a potential area of concern before it becomes an event. Buffer zones can be defined and alerts automated to be proactive in preventing an adverse event (Figure 3).
Process indicators also can be examined using the theory of constraints to identify bottlenecks in processes that delay or interrupt service or product delivery. The information can help justify the allocation, or non-allocation, of capital and human resources to improve process performance.
4. Risk Assessment
Conducting a risk assessment is an opportunity to evaluate the magnitude that potential events might have on an organization’s ability to achieve both its strategic and operational objectives. There are three Six Sigma tools that can be used to translate the historically qualitative approach to more quantitative methods.
- Cause-and-effect matrix helps identify critical steps in a process and the presence, or absence, of controls that prevent, mitigate or monitor adverse events. Numerical scores determine which activities create the greatest risk. Inputs into the process are then scored to refine the areas of potential risk.
- Risk matrix can be used to score the enterprise’s ability to recognize sources of risk and its willingness and abilities to manage those risks. Twelve statements regarding risk are numerically scored to identify areas on which to focus, and opportunities to emphasize and leverage areas of strength.
- Failure mode and effects analysis (FMEA) helps evaluate the risk associated with steps in a process or with the steps in the implementation plan of any project. Potential failure modes and their potential resulting effects are identified and scored for severity of impact to the organization. Potential causes are then identified and scored based on frequency or likelihood of occurrence. Finally, present controls are identified and scored based on the organization’s ability to prevent, mitigate or detect these failure modes. The three scores are then multiplied together to create a risk priority number (RPN).
5. Risk Response
Once the RPN has been calculated, the FMEA requires that an action plan be developed and responsibilities assigned to reduce the risk associated with the critical areas identified. Based on the RPN and the risk tolerance established by the organization, business decisions can be made to avoid or prevent the risk, reduce or mitigate the risk, share the risk, or accept the risk. A formal cost/benefit analysis of these alternatives assists leadership in defining their response. Once the action plan has been completed, a recalculation of the RPN is performed to determine if the activity now falls within the risk tolerance or if additional actions are needed.
6. Control Activities
Once processes have been improved, new processes created or potential risk levels decreased, these gains must be sustained. The concept of a process owner, supported by a formal process control system, is embedded in Six Sigma. This process owner is responsible for the constant monitoring of the output, process and input metrics to ensure the process does not return to its formal state. Control activities, such as policies and procedures, activity management, data integrity, and information processing all ensure leadership’s risk responses are performed with minimal variation and reported accurately.
A process control system contains all the information required to monitor the performance of critical processes. New process maps are used to educate all process workers regarding their role in the process and how their performance relates to the work of others. Critical performance targets are documented and continuously updated. Performance metrics are collected and compared to those performance targets to monitor process performance.
At this stage, statistical tools help evaluate the control activities. Quantifying the relationship of different data sets enhances the process owner’s ability to predict uncertainty. Control charts provide real-time monitoring of both common cause variation and timely evidence of special cause variation requiring immediate management intervention. Finally, hypothesis testing supports the investigation of unexpected results or unusual circumstances.
7. Monitoring
An enterprise’s approach to risk management changes over time. What was once viewed as compliance eventually becomes just good leadership practices. Critical core processes that once crossed multiple functional areas, but lacked both ownership and accountability, are now monitored and managed by process owners who listen to both the ever-changing VOC and VOB to evaluate performance continuously. Six Sigma consolidates multiple process control systems into a framework so process owners can constantly monitor and report key output, input and process metrics that more accurately reflect the enterprise’s performance.
8. Information and Communication
With a process management system to capture information quickly and report it accurately, process owners can focus less on the internal politics that exist between functional silos, and more on improving customer satisfaction and shareholder value. Data that is routinely collected as part of the process control system can be aggregated at the process, business unit and ultimately the enterprise level to provide the basis for management to make better informed and more timely decisions. Simple tools, such as balanced scorecards or risk dashboards, communicate a clear and concise message to all employees: Achieving objectives and managing risk are equally important.