Root cause analysis (RCA) is a way of identifying the underlying source of a process or product failure. As such, then the right solution can be identified. RCA can progress more quickly and effectively by pairing an Ishikawa diagram. You can also use the scientific method in the form of the well-known plan-do-check-act (PDCA) cycle to empirically investigate the failure.
Often, failure investigations begin with brainstorming possible causes and listing them in an Ishikawa diagram. This is not necessarily wrong, but often the ideas listed do not contribute to the failure under investigation.
Write a Problem Statement
Once a problem-solving team has been formed, the first step in an RCA is to create a problem statement. Although critical for starting an RCA, the problem statement is often overlooked, too simple, or not well thought out. The problem statement should include all of the factual details available at the start of the investigation including:
- What product failed
- The failure observations
- The number of failed units
- The customer’s description of the failure
The customer’s description does not need to be correct. It should reflect the customer’s words and be clear that it is a quote and not an observation. For example, a problem statement may start as “Customer X reports Product A does not work.”
The rest of the problem statement would then clarify what “does not work” means in technical terms based on the available data or evidence. A good problem statement would be: “Customer X reports 2 shafts with part numbers 54635v4 found in customer’s assembly department with length 14.5 +/-2 mm measuring 14.12 mm and 14.11 mm.”
Create an Ishikawa Diagram
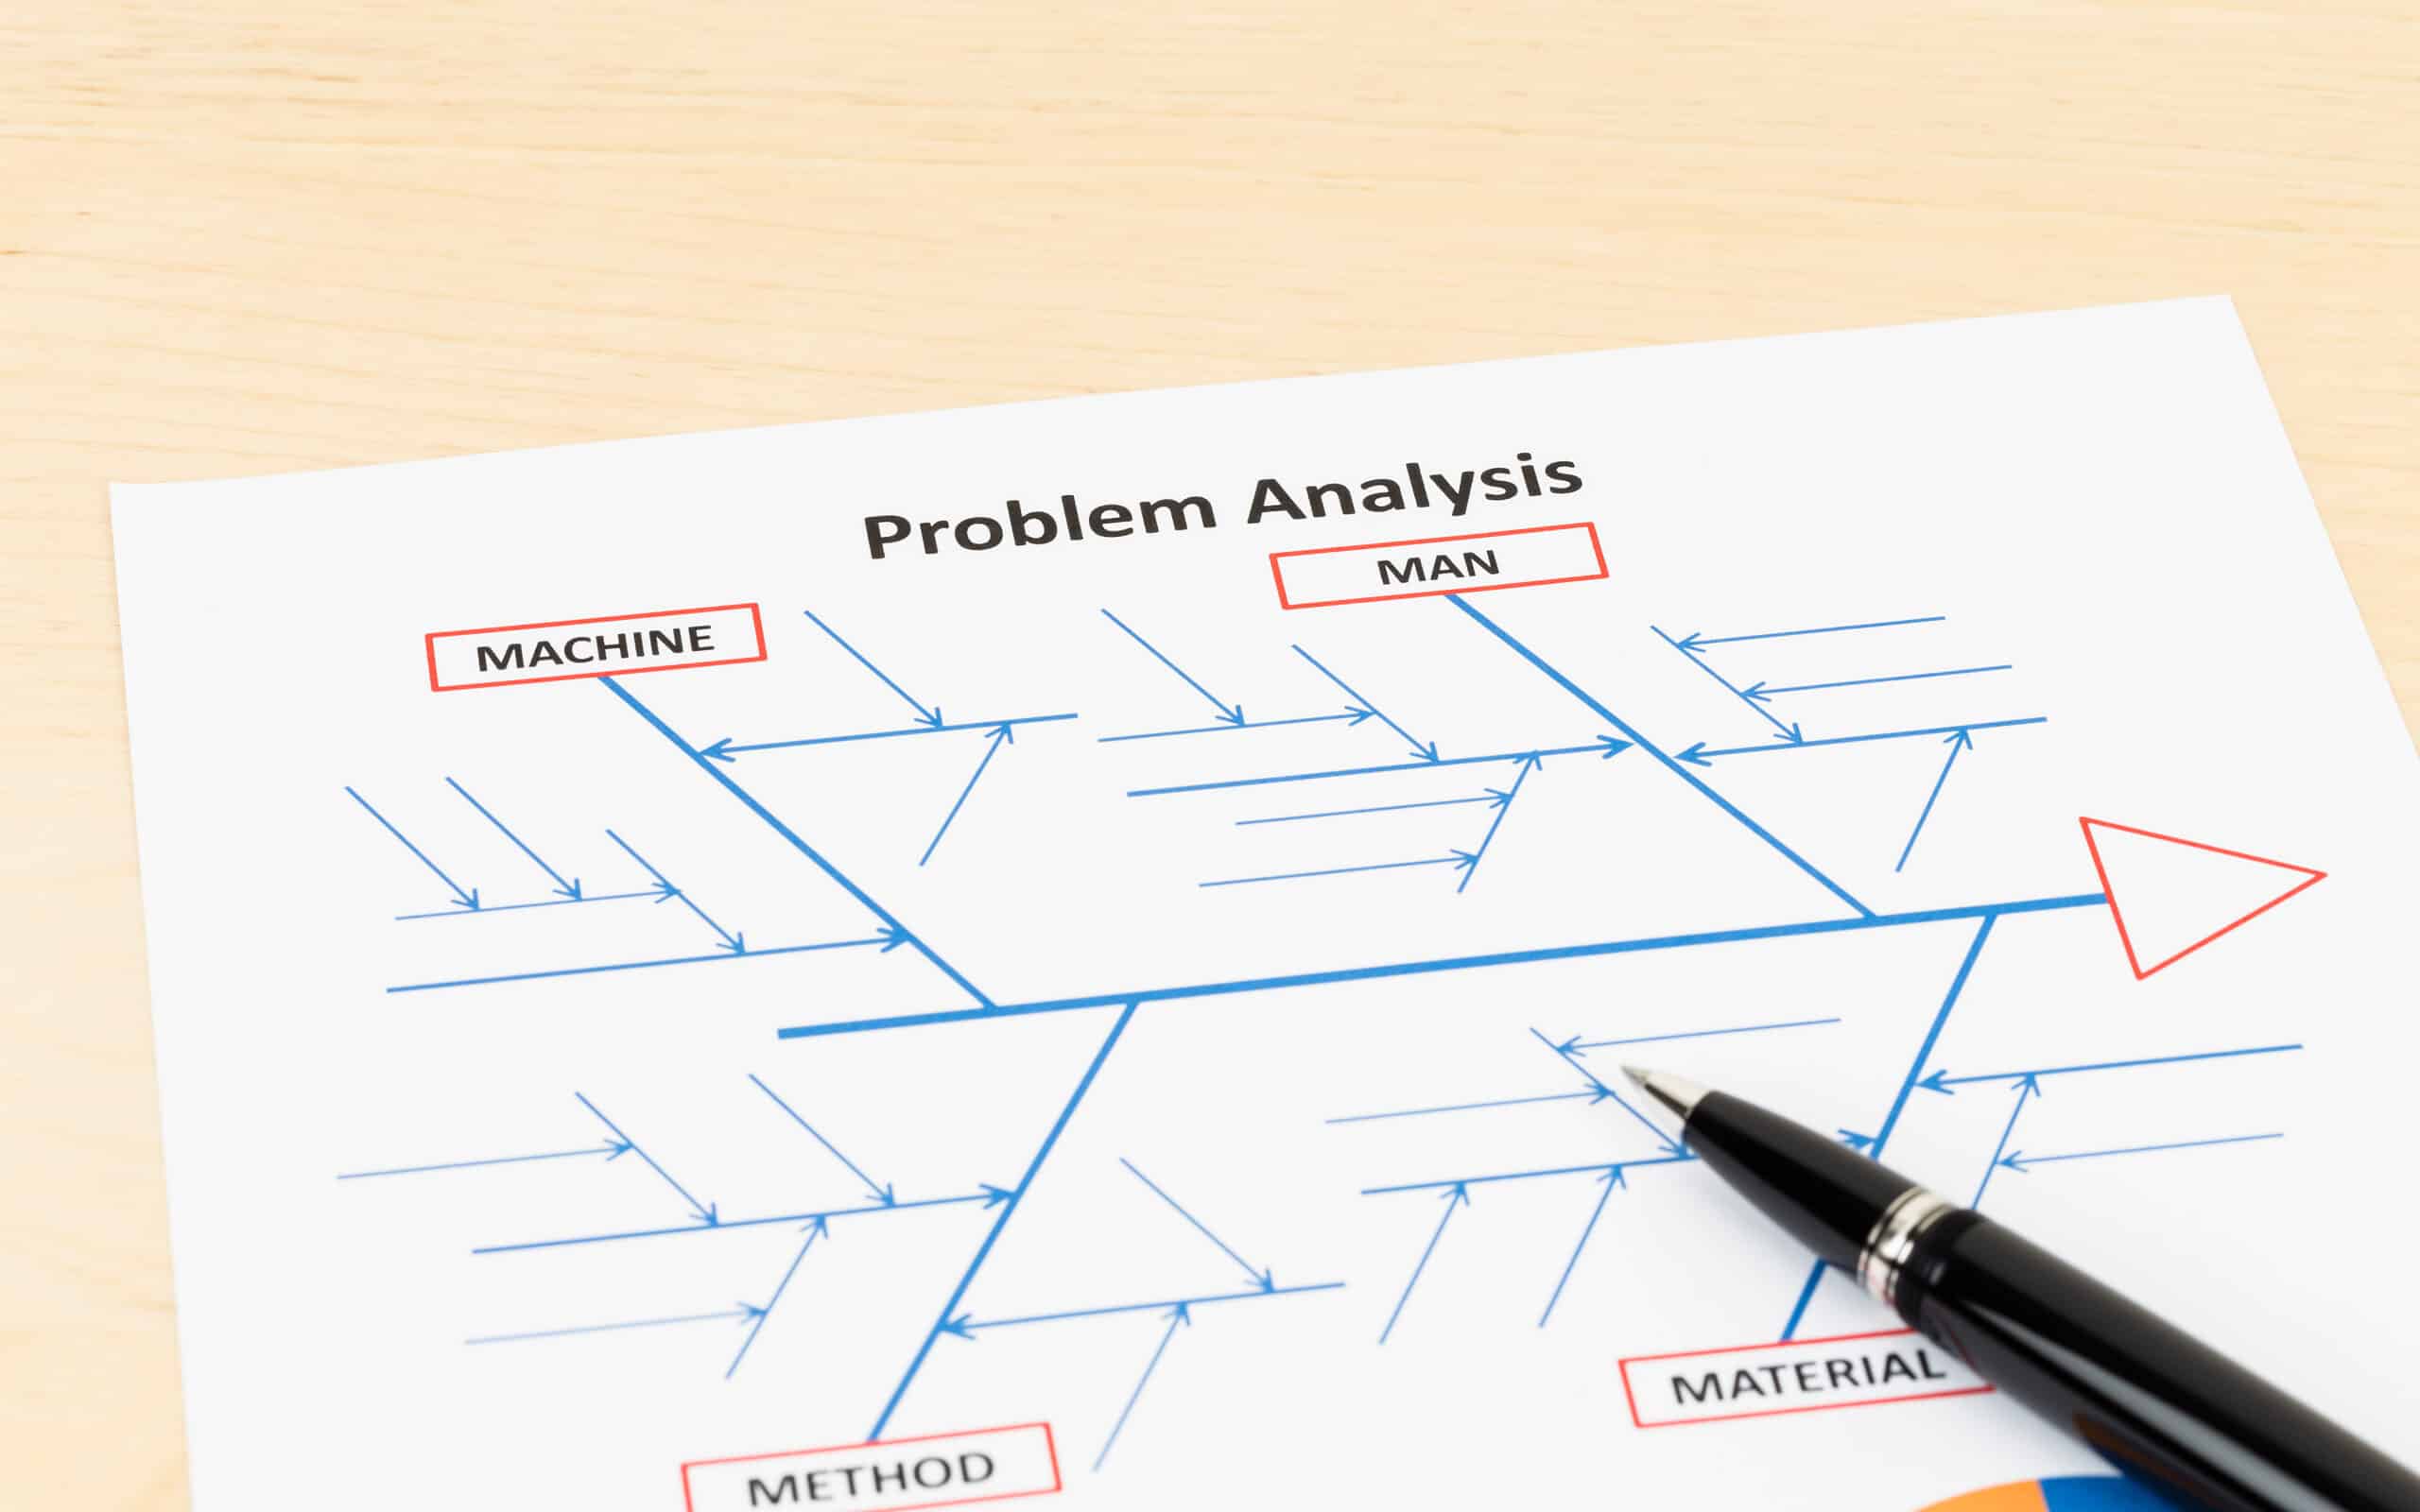
An Ishikawa (or fishbone) diagram should be created once the problem statement is written and data has been collected. An Ishikawa diagram should be viewed as a graphical depiction of hypotheses that could explain the failure under investigation.
It serves to quickly communicate these hypotheses to team members, customers, and management. Hypotheses that have been investigated can also be marked on the Ishikawa diagram. This should quickly show that they are not the cause of the failure (Figure 1).
Is the Ishikawa Diagram Effective?
The Ishikawa diagram is a high-level look at things. It is an effective game plan for communicating the central ideas of your RCA to the entire team. Further, you can take the Ishikawa Diagram and break it down into sub-documents with as much extra detail as you need.
How Did the Failure Happen?
Elements in the Ishikawa diagram should be able to explain how the failure happened. For example, “lighting” is a typical example under “environment”; however, it is seldom clear how lighting could lead to failure. Instead, the result of bad lighting should be listed and then empirically investigated.
In this example, lighting could cause an employee to make a mistake resulting in a part not properly installed. Therefore, the part not properly installed would be listed in the Ishikawa diagram. Simply investigating the lighting could take time and resources away from the investigation so the first step would be to see if a part is installed.
Looking at Causes
Causes of a part not being installed can be listed as sub-branches, but the priority should be on determining if the part was installed or not. If a part is not correctly installed, then use the 5 Whys on that part of the Ishikawa diagram for investigation. The lighting may be a contributing cause, but it should not be the first one investigated. The Ishikawa diagram should be expanded each time 5 Whys is used. For example, the branch may end up as material → part not installed → employee skipped operation → work environment too dark → poor lighting → light bulbs burned out.
In this example, the use of 5 Whys led to the true cause of the failure – the light bulbs burned out. Had the 5 Whys not been used, then the employee may have been retrained, but the same employee or somebody else may have made the same or a different mistake due to the poor lighting.
Each time a cause is identified, the 5 Whys should be used to dig deeper to find the true underlying cause of the failure. Failing to use the 5 Whys risks a recurrence of the failure – the corrective action may only address symptoms of the failure.
Other Potential Causes
Potential causes that do not directly explain the failure, but theoretically could have caused it, can be listed in the Ishikawa. This ensures they will not be forgotten; however, better explanations should be prioritized for investigation. Tracking and monitoring investigation are related actions that can be facilitated by copying the Ishikawa items into a spreadsheet such as the one shown in Figure 2.
Here, each hypothesis from the Ishikawa diagram is prioritized and the highest priority hypotheses are assigned actions, a person to carry them out, and a due date. This makes it easier for the team leader to track actions and see the results of completed actions. Such a tracking list can also be used to communicate the team’s progress to management and customers. New insights may be gained as the investigation progresses. For example, somebody checking the length of a part may have observed damage. This damage could then be entered into an updated Ishikawa diagram and then transferred to the tracking list.
The Scientific Method
The scientific method should be used when investigating the failure. According to biophysicist John R. Platt’s Strong Inference, the scientific method consists of:
- Devising alternative hypotheses
- Devising a crucial experiment (or several of them) with alternative possible outcomes, each of which will, as nearly as possible, exclude one or more of the hypotheses
- Experimenting to get a clean result
- Recycling the procedure, making sub-hypotheses or sequential hypotheses to refine the possibilities that remain, and so on
Each item in the Ishikawa diagrams should be viewed as a hypothesis that could explain the cause of the failure under investigation. A good hypothesis should be simple and general while avoiding making too many assumptions and should be able to make refutable predictions.
A simpler hypothesis is more likely to be correct. In general, it is best to look for the cause closest to the problem and then work back from there using the 5 Whys. The ability to make predictions is essential for testing the hypothesis; a hypothesis that can’t be tested should not be trusted as there is no way to be sure that it is correct. As Dutch psychologist and chess master Adriaan de Groot said, “Where prediction is impossible, there is no knowledge.”
Integrate the Scientific Method
The scientific method can be integrated into RCA by using cycles of PDCA. The planning phases consist of describing the problem, collecting data, and forming a hypothesis.
- P: Whether freshly formed or taken from an Ishikawa diagram, the hypothesis should make some form of prediction (or plan), such as “measurement deviation” predicting “parts will be measured out of specification.”
- D: The next step is do – where the hypothesis is evaluated. This could be as simple as measuring a part or as elaborate as designing a new type of test method.
- C: The check phase is where the results are evaluated and conclusions are formed.
- A: Act is where the conclusions are acted upon. A hypothesis may be rejected or modified based on new evidence or the results of the testing, or a plan may be created to confirm a supported hypothesis.
If the hypothesis is not supported, then the next one in the prioritized tracking list should be selected and evaluated.
Hungry for More Problem-Solving Tools?
When you’ve got issues, you need effective strategies. Root cause analysis is fantastic, but there’s more than one way to approach problem-solving. As such, you might consider the 7 QC tools. These tools are fast and effective, and you likely won’t need too many to solve your problem.
Additional materials you might consider center around the 5 Whys. This effective problem-solving strategy uses iterative questions to get to the very bottom of an issue.
Summary
Using Ishikawa diagrams and the scientific method can serve as a standalone methodology for RCA or be used as part of any RCA process that uses Ishikawa diagrams. This approach is completely compatible with methodologies such as 8D and A3 reports.
References
- de Groot, Adriaan D. 1969. Methodology: Foundations of Inference and Research in the Behavioral Sciences. The Hague: Mouten.
- Platt, John R. 1964. “Strong Inference.” Science 146, no. 3642: 347-353.
- Quine, W.V., and J.S. Ullian. 1978. The Web of Belief. (10th ed.), New York: Random House.