
R-Square (Rsq) is an important calculation used in linear regression for determining the strength of the relationship between two variables. Let’s look at how Rsq is calculated, what it’s actually measuring, and some helpful hints on how to do a regression analysis.
Overview: What is Rsq?
You will typically hear the term Rsq in the context of regression analysis. You might first wonder, if Rsq is the square of R, what is R? R, also known as the Pearson correlation coefficient, is a measure of the strength of relationship between two variables commonly used in linear regression. The formula for R, also written as r, is:
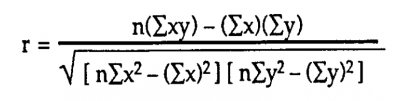
Image source: www.statisticshowto.com.
R is a relative measure. Its value can range from -1 to +1. The higher the number, either positive or negative, the stronger the relationship.
A value of 0 means there is no relationship, while a value of +1 means that there is a perfect positive relationship. That is, if the value of an X variable goes up by 1, the Y variable also increases by 1.
Negative values are just the opposite and represent a negative, or inverse, relationship. As X would go up, the corresponding Y value would go down. This is what a scatter diagram would look like with a moderate correlation r value of 0.40.
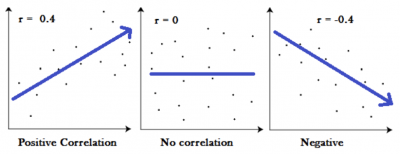
Image source: www.statisticshowto.com.
The left graph above would be interpreted as there being a positive relationship between X and Y that is better than an r value of 0.30, but not as strong as an r value of 0.65. R is then a relative measure of the strength of a relationship.
Rsq tells you something a bit different. Rsq, also known as the coefficient of determination, is the percent variation in your Y variable as explained by the variation in your X variable, or similarly, your regression model. It is an absolute value versus the relative value of r. There is no formula to really calculate the Rsq since it is computed by merely squaring the r value.
Your Rsq value will increase with the addition of more variables, whether they are actually statistically significant or not. That’s when you would use R square adjusted, which accounts for the number of predictors (or Xes) used in your regression model. This will usually occur when you do multiple regression.
The formula for Rsq adjusted is:
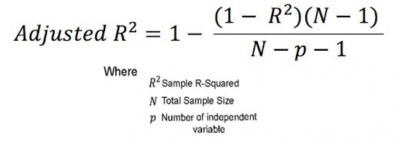
Image source: medium.com.
2 benefits and 1 disadvantage of Rsq
The use of Rsq versus R will improve your interpretations of the linear relationship between your dependent and independent variables (Y and X).
1. Explains variance
The use of Rsq, instead of just r, allows you to make a statement as to the proportion of the variance in your Y, or response variable, that is explained by the variance in your X, or predictor variable.
2. Easy calculation
Rsq is just the square of your r value, which means you simply multiply your r by itself.
3. Increases when you add more predictor variables
Your Rsq will increase as you add more variables, no matter what they are. Unfortunately, it doesn’t have a way to account for whether or not those additional variables add anything to your prediction.
You can get to an Rsq of 100% by adding an infinite amount of variables, but that doesn’t necessarily improve the value of your prediction. That’s why it’s suggested that you use the Rsq adjusted measure, which will account for the number of variables in your equation.
Why is Rsq important to understand?
The calculation of Rsq is simple, so there isn’t much to understand from a computation standpoint. What is important is the interpretation of what Rsq means.
Tells you about your prediction model
The strength of your prediction model is what you use to predict future values and make business decisions.
Value will always be positive
Unlike your R value, which can be both positive and negative, your Rsq value will always range from 0% to 100%, or alternatively 0 to 1. Therefore, your Rsq does not indicate the direction of your relationship — whether it is positive or inverse.
Represents small residuals
Residuals are the distances that your data points are away from your prediction line. The closer your values are to the line, the better the fit, correlation, prediction, and Rsq.
An industry example of Rsq
The manager of Line 1 was trying to determine whether he could use machine temperature and pressure as a predictor of a quality characteristic of his production process. He knew just enough to get Excel to calculate the R value from his sample data of the process.
He prepared a presentation for the VP of manufacturing and was about to proudly announce that he had a calculated R value of 0.7, which he believed was a really high correlation. He intended to run his process using his prediction model.
Just before the meeting, the Black Belt in his department read through the manager’s presentation for the VP. He reminded the manager that while 0.7 was a decent value for R, his Rsq value was only going to be 0.49. That meant only 49% of the variation in the quality characteristic was explained by the variation in temperature and pressure.
The BB advised the manager that he might want to try to identify some additional process variables that impact on the quality characteristic in order to improve the prediction capability of his model.
The meeting was postponed while the manager gathered information on some additional variables. With these additional variables, the adjusted Rsq was calculated at 71%, which meant his prediction model would now provide predictions with less error.
3 best practices when thinking about Rsq
Since Rsq is just a calculation, the best practices of completing a regression analysis are what’s important. Here are a few tips regarding regression.
1. Analyze your residuals
Having a high Rsq value is not sufficient to declare that you have a good prediction model. You must confirm your analysis by analyzing your residuals.
2. Plot the data first
Before doing any calculations, create a scatter plot so you can get a quick visual and a possible hint of what’s coming from your calculations. If you see a wide distribution of points, don’t expect that your correlations, either R or Rsq, will be a high number.
3. Don’t add extraneous variables
Don’t keep adding variables in the hopes that your Rsq value will increase. Those variables may not have significance or increase the value of your prediction. Use Rsq adjusted if you have more than one predictor variable.
Frequently Asked Questions (FAQ) about Rsq
What does Rsq tell me?
It will tell you what percent of the variation in your Y (response or dependent) variable is explained by your X (predictor or independent) variable.
What is a good value for Rsq?
The standard consulting answer of “it depends” might be appropriate. Do you want a high value for the sake of a high value? If so, just keep adding values — whether they are meaningful or not — to ramp up your Rsq. That’s not recommended, though.
Do you have a single X predictor or multiple ones? In some cases, an Rsq of 15%-20% might be good for a single value. For a multiple regression, you might be happy with a 65%-75% Rsq. Remember that your Rsq is just a calculation of the underlying sample data.
What’s the difference between the Rsq and the adjusted Rsq?
Rsq assumes that every variable in your model explains the variation in your dependent variable. The adjusted Rsq tells you the percentage of variation explained by only those variables that actually impact your dependent variable.
Final notes on Rsq
Rsq is merely a mathematical calculation, but it represents a great deal of information about how well your linear regression model can be used for predictions. Rsq tells you the amount of variation in your dependent variable (Y) that is explained by the variation in your independent variable (X). Don’t be tempted to keep adding variables to increase your Rsq value. They may not be significant and will not really help your prediction.