
Six Sigma is a data-driven approach to quality, aimed at reducing variation and the associated defects, wastes, and risks in any process. This article explores the basics of Six Sigma process quality – definition and measurement.
Defining Standard Deviation
In a set of data, mean (μ) and standard deviation (σ) are defined as:
μ = x1 + x2 + x3 + … + xn) / n
Where x1, x2, …, xn are data values n is the number of data elements, and

The standard deviation shows the extent of variation or spread of data. A larger standard deviation indicates that a data set has a wider spread around its mean. Process data usually has a normal distribution. The distance from the mean μ to a data value in terms of data units can be measured. For example, a data point with a value of x = 31 seconds is 6 seconds away from a mean value of 25 seconds. You can measure the distance by counting the number of standard deviations in the distance. If the standard deviation is 2 seconds, the same point is 6/2 or 3 standard deviations away from the mean. This count is denoted by the sigma level, Z, also known as the Z-score, as shown below.
Z = (x – μ) / σ
Z = (31- 25) / 2 = 3
Specification Limits and Defect Rates
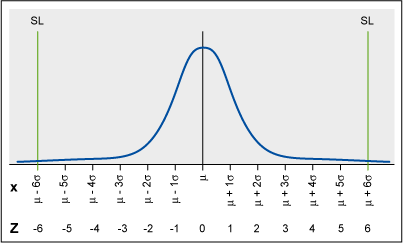
In a process, deviations from the target or mean are accepted to a certain value defined by the specification limits (SL) around the mean. Any value beyond the specification limit indicates a defect or unacceptable result. The farther the specification limits are from the mean, the lower the chance of defects.
A Six Sigma process has a specification limit which is 6 times its sigma (standard deviation) away from its mean. Therefore, a process data point can be 6 standard deviations from the mean and still be acceptable. (See Figure 1.)
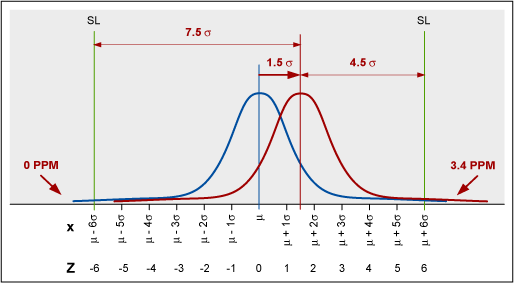
In a stable process, the mean naturally shifts as much as 1.5 sigma in the long term on either side of its short-term value. The red lines in Figure 2 (below) show the extreme case of the 1.5-sigma mean shift to the right. The right specification limit is at 4.5 sigma from the mean with a defect rate of 3.4 parts per million (PPM).
The left specification limit is at 7.5 sigma from the mean with a defect rate of 0 PPM. The overall defect rate, therefore, is 3.4 PPM. A similar argument applies to the extreme case of a 1.5-sigma shift to the left. A Six Sigma process is 4.5 sigma in the long term, and the 3.4 PPM defect rate is the 1-sided probability of having a data value beyond 4.5 sigma from the short-term mean.
Putting It Together
The 1.5-sigma shift makes defects approach 0 on the opposite side of the shift even at lower sigma levels. The one-sided defect rate applies to any capable process with 1-sided or 2-sided SLs, even at a 3-sigma level.
Given the specification limit, SL, the process sigma level, or process Z, is:
Z = (x – μ) / σ = (SL – μ) / σ
In this example, the process sigma level for a specification limit of 31 seconds is:
Z = (SL – μ) / σ
Z = (31 – 25) / 2 = 3
Therefore, the process is at a 3-sigma quality level. To bring the process to the golden Six Sigma quality level, the Process Sigma would need to come down to 1.
Z = (31 – 25) / 1 = 6
In general, you can rearrange the Z formula to calculate the maximum allowable Process Sigma, or standard deviation, for any sigma level.
Z = (x – μ) / σ
σ = (x – μ ) / Z
For example, given a mean of 25 seconds and SL of 31 seconds, for a Six Sigma quality level, the required process sigma is calculated as:
σ = (31 – 25) / 6 = 1
Similarly, for a 3-sigma quality level, the process sigma must be:
σ = (31 – 25 ) / 3 = 2
Referring back to the short- and long-term behavior of the process mean, there are 2 values for Z, short-term Z, or Zst, and long-term Z, or Zlt.
Zlt = Zst – 1.5
In Sigma Level calculations, use Zst. A Six Sigma process is 6 sigma in the short term and 4.5 sigma in the long term or:
Zst = 6
Zlt = Zst – 1.5 = 4.5
Clarifying Process Sigma and Sigma Level
Sometimes the term Process Sigma works instead of the Process Sigma Level, which may confuse. Process sigma indicates the process variation (i.e., standard deviation). You measure in terms of data units (such as seconds or millimeters), while Process Sigma count Z, or Process Sigma level, is a count with no unit of measure.
Other Useful Tools for Your Production
While we’ve discussed Process Sigma at length, there are other things you should take a look at. Now, we’ve mentioned that Sigma Level and Process Sigma are different beasts. However, it would do you well to understand the differences between Sigma Level and Cpk, as well.
Converting between yield and Sigma Level can be a time-consuming process. However, our handy tool eliminates the guesswork, freeing up valuable time so you can get back on track.
Process Capability and Six Sigma
Another measure of process quality is process capability, or Cp, which is the specification width (distance between the specification limits) divided by 6 times the standard deviation.
Cp = (Upper SL – Lower SL) / 6σ
The recommended minimum or acceptable value of Cp is 1.33. In terms of Six Sigma, this process capability is equivalent to a Sigma level of 4 and a long-term defect rate of 6,210 PPM. Process capability for a Six Sigma process is 2.