
As with all probability distributions, the Normal Distribution describes how the values of your data are distributed. Subsequently, it is one of the most important probability distributions in statistics because it accurately describes the distribution of values for many natural phenomena.
Overview: What is the Normal Distribution?
The Normal Distribution, also known as the Gaussian Distribution, is a hypothetical mathematical construct and one of the most common statistical distributions.
In 1809, Johann Carl Friedrich Gauss, a German mathematician and physicist described the distribution in the context of measurement errors in astronomy. During the 19th century, this tool was widely applied in the areas of applied probability and statistics.
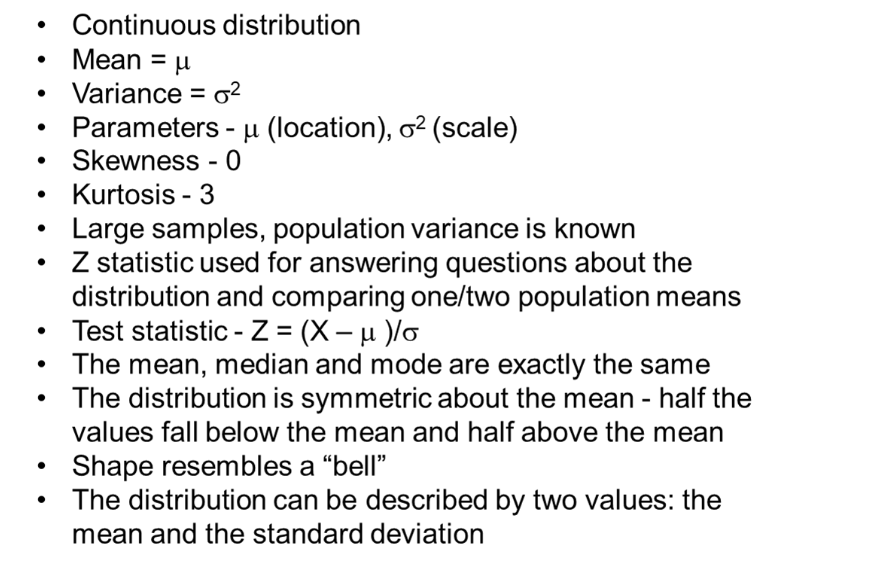
Since this is a hypothetical curve there you won’t find it in the real world. The key is how closely it describes and estimates your actual data. With this in mind, the following are the characteristics of this tool:
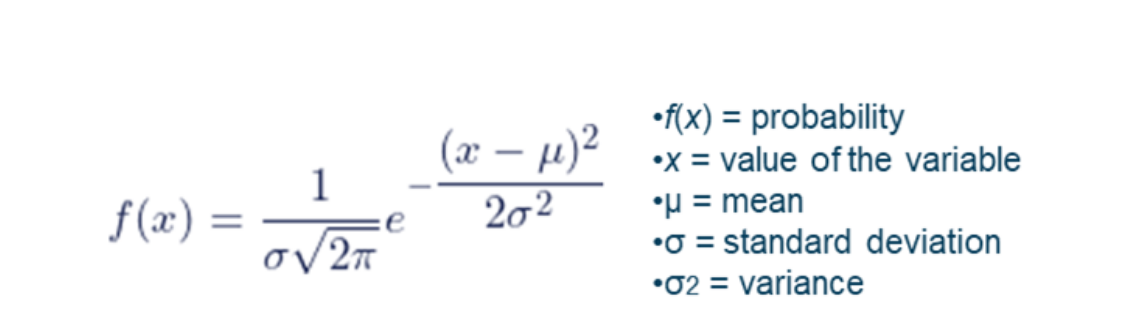
The formula for this distribution’s probability density function is shown below. Note that the only variable parameters are the mean and standard deviation.
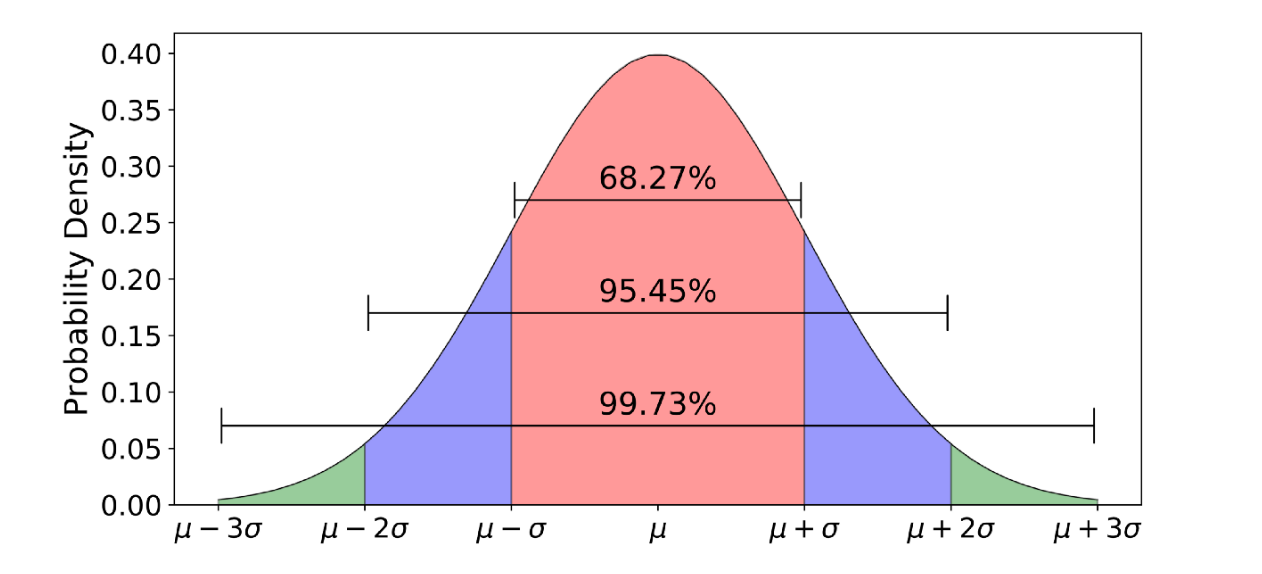
The Empirical Rule describes how to visualize the individual values of your data across a normal curve. It will be based on the mean and standard deviation of your data. This is shown below.
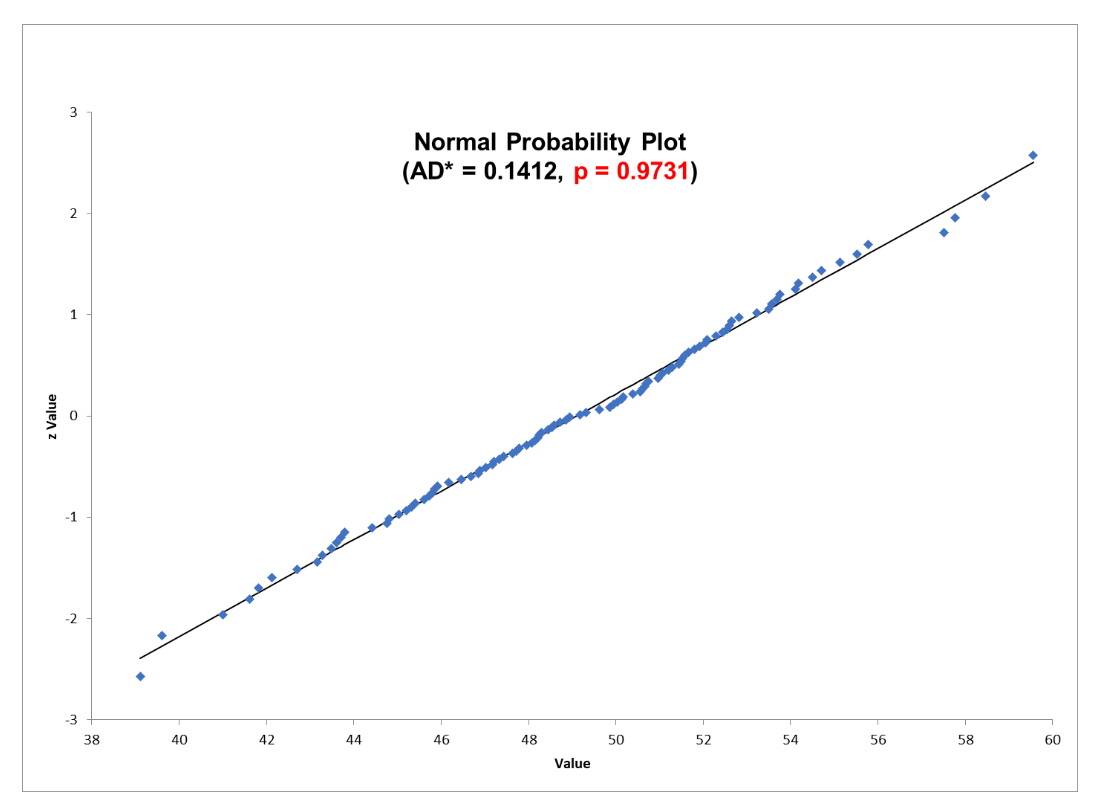
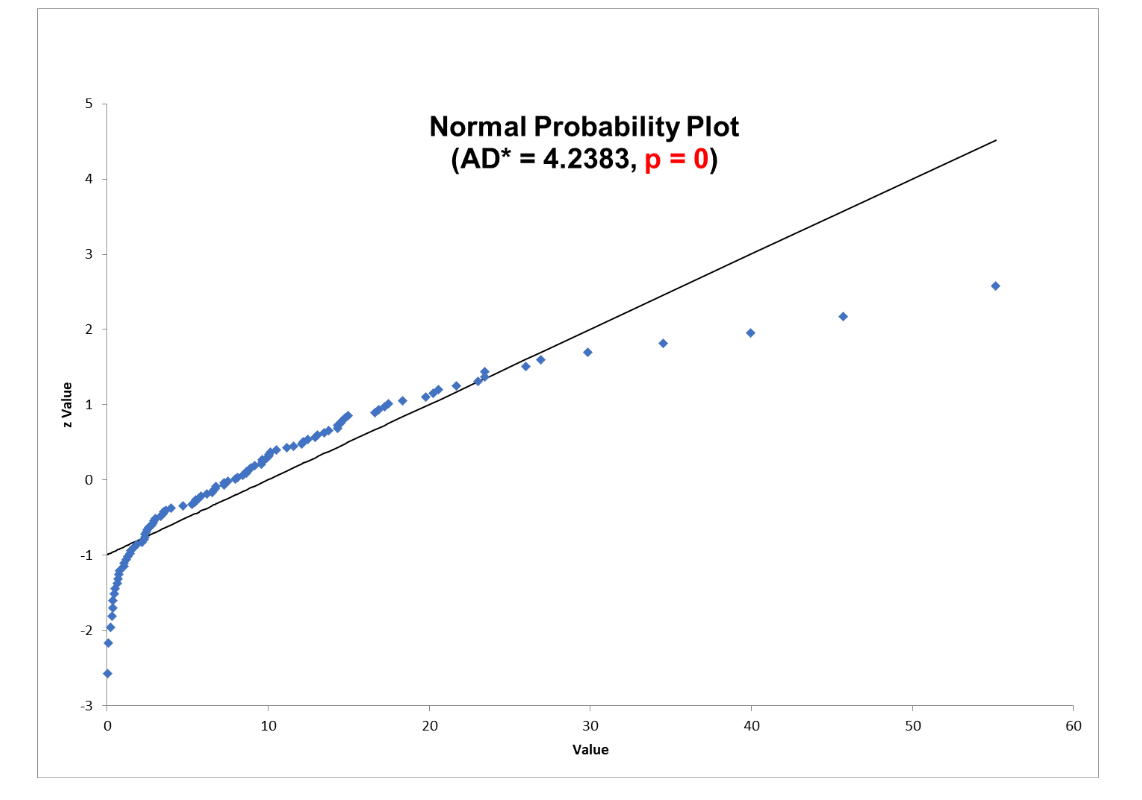
If your data is not approximately distributed as the above, you may not want to declare your data is normal. You can use a graphical Probability Plot or a statistical test like the Anderson-Darling test and use the p-value to test whether your data is non-normal.
3 Benefits
As one of the most common statistical distributions, there are many benefits of the Normal Distribution.
1. Describes Many Processes
It can model many common processes and as such, is the underlying assumption for the use of many statistical tools.
2. Existence of Tables
As a result of such a common tool, statisticians have several Normal and Standard Normal Distribution tables for calculations and predictions.
3. Link to the Central Limit Theorem
A major benefit of the normal distribution is the linkage to the Central Limit Theorem. This theorem states that when the sample size is sufficiently large, the distribution of sample means will approach a normal distribution regardless of the shape of the distribution from which the samples came.
As such, this allows you to use inferential statistical methods that assume normality, even if the individual data in your sample doesn’t follow a Normal Distribution.
Why Is the Normal Distribution Important to Understand?
As the most common statistical tool, it is important to understand what the Normal Distribution is and how to properly use it.
Assumption of Many Statistical Tests
Many statistical tests have an assumption that your data should fall under a normal distribution for the test to be valid. This frequently occurs in hypothesis testing.
Represents Many Natural Phenomena
Many natural processes can be classified with this tool.
Computations Are Not Complex
It relies on two parameters, the mean and standard deviation making calculations easy to do.
Why It Matters
Statistical analysis is an important part of developing any project. However, the important thing to keep in mind is that you’ve got to have some sort of baseline to anchor a project. That’s where a normal distribution arises. You know what the ideal is, but how your data fits alongside that can reveal quite a bit.
An Industry Example of the Normal Distribution
A Six Sigma Green Belt wanted to know whether his data fulfilled the assumption of normality as required by the 2-sample t-test he wanted to do. Below are two probability plots for his two sets of data.
Notice that one can be considered normal while the other is not. If the p-value is greater than .05 you can claim the data is not different than normal. If less than .05, you will reject the null hypothesis and conclude the data is not normal.
3 Best Practices When Thinking About the Normal Distribution
Despite its simplicity, there are some things to keep in mind when utilizing this tool to describe your process data.
1. Be Sure You Have Enough Data
It is only a good predictor if you have an adequate amount of data. It takes a sufficient amount of data for the distribution to form.
2. Be Sure Your Data Is Continuous
The Normal Distribution is continuous so it is only valid for continuous data. In some cases, you can use the Normal Distribution to approximate discrete distributions such as the Binomial and Poisson.
3. Test Your Data for Normality
There are some simple statistical as well as graphical methods for testing the normality of a set of data. The Normal Probability Plot and the Anderson-Darling Test can be used as a graphical and statistical tool for assessing non-normality. But, keep in mind, that there are statistical tools that are robust and forgiving if there is a lack of normality.
Other Useful Tools and Concepts
Normal distributions are just one piece of the puzzle when it comes to conducting any sort of statistical analysis. Having a basic understanding of the principles behind statistics is key, so our primer on the fundamentals of the subject is required reading.
Further, you might be looking to increase overall quality in your pipeline. The House of Quality approach is comprehensive, encompassing everything from production to the corporate culture in your organization. Learn all about how to implement it in our overview.
Wrapping Up
The Normal Distribution is a continuous probability distribution defined by the mean and standard. It is one of the most common distributions because it describes many natural phenomena. As a result, it is the underlying assumption of many statistical tools.
The Empirical Rule helps describe how your data values are distributed under the curve. Statistical and graphical tools can be used to confirm whether your data approximates a Normal Distribution.