
The famed statistician, Dr. W. Edwards Deming, frequently talked about data and said, “Without data, you’re just another person with an opinion.” Let’s learn some more about data.
Data refers to any information, facts, or statistics that can be collected, stored, and analyzed. It can be in the form of numbers, text, images, audio, or video. Data can be structured or unstructured and can come from various sources, such as sensors, surveys, social media, or transactions.
Data is the foundation of any data-driven decision-making process and is essential in many fields, including business, science, healthcare, and technology. With the increasing amount of data available, there is a growing need for effective data management and analysis tools to make sense of the information and extract insights.
Overview: What is data?
Patterns, trends, and tendencies give you insight into what is going on in your data and thus your process. Some of the key insights include:
Location – central tendency of your data (eg: mean, median, mode)
Spread – variation (variance, standard deviation, range)
Shape – pattern or distribution (eg: normal, binomial, Poisson)
Stability – consistency over time (eg: control charts)
The graphic below shows the common types of data.
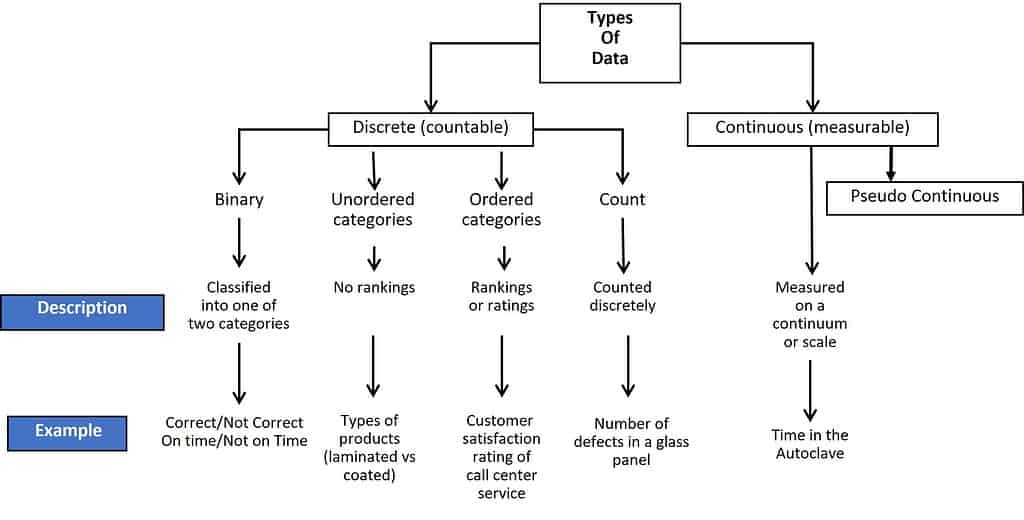
Knowing the type of data you collect is important because:
- It determines your choice of analytical tools
- It dictates the amount of data required: in general, continuous data often requires a smaller sample size than discrete data
- It provides information about current and historical process performance
- Continuous is usually the preferred type of data
Data has many advantages, including:
Data provides insights
By analyzing data, you can gain valuable insights and identify patterns and trends that can help you make informed decisions.
Data can improve performance
By tracking performance metrics and analyzing data, you can identify areas for improvement and make data-driven decisions to optimize performance.
Data supports innovation
Data can be used to identify new opportunities and create innovative solutions that can drive growth and competitiveness.
Data improves efficiency
By automating data collection and analysis, you can reduce manual effort and improve the efficiency of business processes.
Data enhances customer experience
By analyzing customer data, you can personalize and improve the customer experience, leading to increased loyalty and satisfaction.
Data improves risk management
By analyzing data, you can identify and mitigate risks, reducing the likelihood of negative outcomes.
Data enables collaboration –
By sharing and collaborating on data, teams can work together more effectively, leading to better decision-making and outcomes.
An industry example of data
The General Manager was interested in gathering data about the performance of the delivery process. Initially, he wanted to collect the percentage of orders that were delivered on time. This data would be defined as discrete data and was formatted as “on-time” or “not-on-time”.
The company Six Sigma Black Belt suggested that the GM collect data on the actual delivery time which would be formatted as continuous data. This would allow the GM to see if the process was getting better or worse over time and would provide more information.
Frequently Asked Questions (FAQ) about data
Here are some frequently asked questions about data:
What is data?
Data refers to any information, facts, or statistics that can be collected, stored, and analyzed.
Why is data important?
Data is important because it can provide valuable insights, support innovation, improve performance, enhance customer experience, and improve risk management.
What are some examples of data sources?
Examples of data sources include sensors, surveys, social media, transactions, and website analytics.
What is big data?
Big data refers to large and complex data sets that cannot be analyzed using traditional data processing methods.
What is data analytics?
Data analytics is the process of analyzing data to identify patterns, trends, and insights that can inform decision-making.
What is data mining?
Data mining is the process of analyzing large data sets to identify patterns and relationships that can be used to make predictions and inform decision-making.
What is data visualization?
Data visualization is the process of presenting data in a visual format, such as charts, graphs, or maps, to make it easier to understand and identify patterns and trends.
What is the preferred data type?
Continuous data is preferred because of its granularity, ease of analysis and reduced sample size needed for analysis.