

The Corporation of the City of Kawartha Lakes (the City), Ontario, Canada, is a single-tier municipality that covers a land area of 3,067 square kilometers and includes more than 250 lakes. In addition to approximately 73,000 permanent residents there is a large seasonal population of approximately 31,000 residents each summer. More than 77 percent of residents live in rural communities.
Effective marketing and advertising campaigns are important to the City’s economy – the City is a vacation destination and relies heavily on the revenue generated from tourists. Additionally, the City’s full-time residents rely on marketing and advertising information (websites, brochures, pamphlets and newspaper advertisements) to keep informed about programs and services offered by the City. There is one local paper and one small local publication that provide home delivery service to 76 percent of households.
Define and Measure
Marketing and advertising campaigns were launching haphazardly across the City. Departments like public works and parks and recreation as well as the office of the chief administrative officer (CAO) had their own processes for marketing and advertising tasks – leading to an inconsistency in final products. For example, those final products – brochures, advertisements and websites – sometimes lacked corporate branding and did not always display the City’s logo, or the logo would appear incorrectly.![]()
A SIPOC (supplier, input, process, output, customer) map showed that although City staffers who worked on marketing and advertising projects recognized that gathering customer requirements was important, the City had yet to gather information on the format customers would prefer to receive information in.
An analysis of 2012 marketing and advertising costs showed that 75 percent of overall expenditures (for advertisements, brochures and booklets) were under $5,350 (Figure 1). Across all offices, supervisors had signing authority for up to $5,000. Moving forward, the City wanted supervisors to have authority for approving the majority of marketing and advertising campaigns.
Metrics
Departments were asked to track the time and staff involved in the common task of placing an advertisement in the newspaper. The common process steps were mapped (Figure 2) and the analysis of value-added time spent on this task revealed that senior managers (defined as director, the CAO or manager) were involved in 56 percent of the process steps (Figure 3). If supervisors were granted the authority to approve approximately 75 percent of marketing and advertising campaigns, the need to involve directors, the CAO and managers in approvals and reviews would be reduced, saving $1,198 per hour.
Completion of a failure mode and effects analysis (FMEA) on this process identified that only 37.5 percent of the process steps included prevention or detection controls to address associated risks. Correspondingly, the mean detection score was 9. The highest-ranked risks included dissatisfied and misinformed customers. Those risks could lead to a lack of participation in programs meaning reduced revenue and business for the City’s tourism business – as well as an overall failure to meet customer requirements.
Customer requirements had not been gathered or were unknown across the corporation, and the effectiveness of marketing and advertising campaigns were not tracked or evaluated. There was a large variance in process and cycle times (developing the product to final distribution to customers) and 47 percent of total time spent was on non-value added activities.
The information learned during the Define and Measure phases helped clarify the project goals: 1) to determine the City’s customers’ preferred media and delivery requirements and 2) to create a corporate standard process for marketing and advertising.
Analyze
Throughout the project a variety of techniques were used to gather customer requirements, including surveys, focus groups and one-on-one interviews. It was important to learn what the City’s customers (seasonal as well as permanent) wanted and needed to know, how customers accessed information, and their preferred method for receiving and accessing City information.
|
Customers’ Preferred Methods of Contact |
|
|
Method |
Percentage |
|
|
75 |
|
City website |
59 |
|
Internet search |
47 |
|
|
41 |
In the City, 39 percent of the population is greater than 55 years of age. The perception was that these older customers preferred to receive City information in print form. What customers told the City, however, was that they preferred to receive information by email (see table above). (The data reflects preferences from combined voice of the customer research.) The validity of the surveyed sample was questioned and a Chi-square goodness-of-fit test was applied. The tests demonstrated that, statistically speaking, the sample was representative of the population.
Customer requirements were ranked in order of priority. Customers wanted:
- Service right away.
- Information to be accurate.
- Program- and service-specific information.
- Access to general information.
- Information to be aesthetically pleasing.
- Information to be accessible.
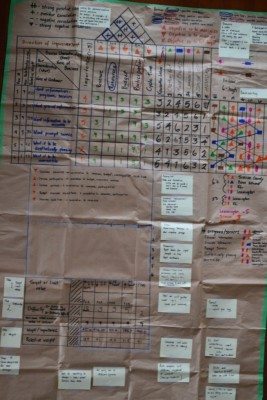
Using the quality function deployment (QFD) tool, the team added the identified customer needs as specific and measurable quality requirements of the process (Figure 3). The tool determined the relationships between the voice of the customer and the voice of the business (VOB), and examined the correlation within VOB requirements. Five similar-sized and single-tier municipalities were compared to graphically show the City’s current performance in relation to meeting customer requirements.
Design
Building upon the information and results gathered during the Measure and Analyze phases, design requirements for the new process were developed.
It was determined that the new process must:
- Identify the customer.
- Gather customer requirements on an ongoing basis with respect to what information customers are looking for and their preferred distribution method for receiving such information.
- Address approvals – the when, where, why and who.
- Include a central position to act as a filter for all advertising campaigns across the City to avoid duplication, ensure adherence to branding guidelines and to encourage appropriate support.
- Measure and evaluate the return on investment.
- Define how and what will be measured.
- Adhere to City policies and bylaws.
- Consider marketing and advertising features such as human systems, key processes, materials and equipment.
Figure 5 shows the redesigned advertising and marketing process.
The following tools and resources were required:
- Templates
- Standard operating procedures
- Creative briefs
- Advertising briefs
- Resources – positive correlation to VOB
- Branding guidelines
Verify
Immediate savings of 15 percent (or approximately $90,000) in hard costs from printing and copying materials were realized. In addition, an immediate 20 percent improvement in productivity (through elimination of the duplicated review and approval steps) was gained, with ongoing annual savings of approximately $53,000 projected.
Conclusion
The end result was a new process for marketing and advertising within the City of Kawartha Lakes that identified a staff position to act as a central filter to ensure consistent branding and messaging, and to ensure that corporate and customer requirements are being met. The new process was designed based on clearly defined customer requirements that will eliminate hard costs while also improving productivity.