Follow Me On:
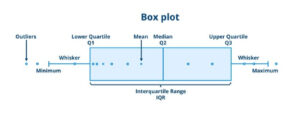
Interquartile Range
Updated:The difference between the first and third quartiles.
Read more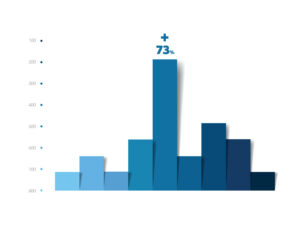
Frequency Plot
Updated:A frequency plot is a graphical representation of the distribution of continuous data based on how often a particular value occurs.
Read more

Quantitative Variable
Published:Quantitative data represents values and numbers which can be measured or counted and used in mathematical operations such as addition, subtraction, multiplication, or division.
Read more
The 2.67 Million Dollar Mystery (And How 5 LSS Tactics Solved It)
Published:This major beverage manufacturer was spending millions of dollars per year to replace recyclable plastic shells to transport 2-liter bottles from the plant to their customers. Where did all the plastic shells go? Let’s find out. The process of retrieving delivered plastic shells from the customer should have been easy, but apparently it wasn’t. The […]
Read moreProcess Management
Published:Process management is a structured process for assuring that all your processes are aligned to ensure you can attain the organization’s strategic goals.
Read more
Following the Road to Improvement
Published:As a recently promoted Vice President, Chuck needed to quickly understand what all his people were doing. Chuck, a longtime employee of a major utility company, had been recently promoted to Vice President to take over the leadership of a wide range of different functions than what he had been managing. As a result of […]
Read moreSix Thinking Hats
Published:Have you ever been on an improvement team that just doesn’t work as well as you expected? Was it because people weren’t trying or was the mix of personalities and perspectives not conducive to working together for a solution? Let’s see how one company handled this problem. Using the Six Thinking Hats helped this company […]
Read more
Strategic Planning: Defining Vision, Goals, and Objectives for Success
Updated:Strategic planning is a disciplined effort to produce fundamental decisions and actions that shape and guide what an organization is, what it does, and why it does it, with a focus on the future.
Read moreConvert DPMO/Sigma to Cpk
Published:DPMO, Sigma Level and Cpk are three metrics you can use to measure how well your process is performing.
Read moreAchieving Organizational Excellence through GOAL Deployment
Updated:Using GOAL Deployment in support of their Strategic Plan, this company was able to align goals and objectives and achieve impressive organizational improvements The Company historically used yearly Strategic Planning to lay out its macro goals and initiatives. This was done by each functional area of the company submitting what they believed they wanted to […]
Read more
Understanding Systems Thinking: A Guide to the Key Concepts and Benefits
Updated:Systems thinking is based upon the concept that all systems are composed of interconnected parts. These connections and interrelationships cause behavior of one part to impact another.
Read more
What is The Poisson Distribution? A Complete Guide
Updated:The Poisson distribution is a discrete probability distribution that provides the probability of a given number of events occurring in a specified interval of time or space.
Read more
The Role of Inferential Statistics in Data Analysis
Updated:Inferential statistics consists of several statistical tools that will allow you to make an inference about the population from sample data.
Read more
Capability: Formulas for Measuring Process Performance
Updated:Capability is the ability of your process or product to meet expectations of your customers or any internal organizational expectations, goals or targets.
Read more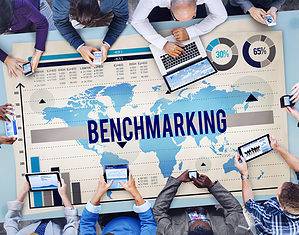
How to Use Benchmarking to Drive Performance Improvements
Updated:Benchmarking is comparing what you do to how other organizations do it.
Read more
The Significance of Measurement Variation in Your Process
Updated:In statistics, variation is a measure of the dispersion or spread of your process data.
Read more
Maximizing Productivity with Single Minute Exchange of Die (SMED)
Updated:SMED or Single Minute Exchange of Dies is a process for reducing changeover time.
Read more
Tips and Tricks for Calculating the Trimmed Mean in Your Data Analysis
Updated:Trimmed mean is defined as the mean calculated by trimming 5% data sets from the top and bottom of data sets
Read more
What are Dependent Variables and Why Do They Matter in Data Analysis?
Updated:In business, your profit will be dependent upon several variables such as material and labor costs. Other variables will also be dependent upon several other independent variables.
Read more