Follow Me On:
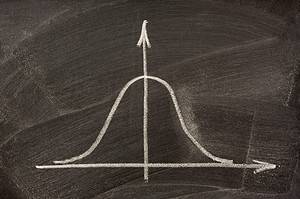
Navigating Data Analysis: The Importance of Testing for Normality
Updated:Is your data normal? Oh no! Is that a problem? The concept of data normality can be important when using certain statistical tools to make data-driven decisions.
Read more
Application of Lean Six Sigma to the EHS Function of an Organization
Updated:Lean Six Sigma (LSS) is a structured approach that combines two powerful process improvement methodologies: Lean, which focuses on eliminating waste, and Six Sigma, which focuses on reducing variation and defects. When applied to the Environmental, Health, and Safety (EHS) function of an organization, Lean Six Sigma provides a robust framework for driving operational efficiency, […]
Read more
Pugh Matrix: Learn How This Tool Empowers Your Decision-Making Process
Updated:You are often faced with many options on how to improve the process. Which one is the best? The Pugh Matrix is a simple tool for you to decide which approach — or hybrid of approaches — you should use.
Read more
MVP (Minimum Viable Product): From Concept to Reality
Published:In the world of startups and product development, the Minimum Viable Product (MVP) has become a cornerstone of agile innovation. An MVP is a product with just enough features to attract early adopters and validate a product idea. It allows businesses to test their hypotheses and gather valuable feedback without expending excessive resources. […]
Read more
Sigma in Statistical Analysis: What You Need to Know
Updated:Sigma is the eighteenth letter of the Greek alphabet and is used as a common notation in statistics as a measure of summation and variation.
Read more
The 8 Wastes of Lean: Understanding and Addressing Them in Your Organization
Updated:Waste is all around your organization. Using TIMWOODS and DOWNTIME, you will learn how to identify the 8 Wastes of Lean and eliminate it to improve your organization.
Read more
Project Sponsor vs. Deployment Champion in Six Sigma: What’s the Difference?
Updated:What is a Project Sponsor? A Six Sigma project sponsor plays a key role in Six Sigma methodology who provides overall support, guidance, and resources to ensure the success of a Six Sigma project. The project sponsor is typically a high-level executive or manager within the organization who has the authority to allocate resources and […]
Read more
Black Belt vs. Master Black Belt in Six Sigma: What’s the Difference?
Published:What is a Black Belt (BB)? A Six Sigma Black Belt (BB) is a trained and certified professional who has achieved a high level of expertise and experience in the Six Sigma methodology. Six Sigma is a data-driven methodology and management philosophy that aims to improve the quality of processes, reduce defects, and minimize variability […]
Read more
Black Belt vs. Green Belt in Six Sigma: What’s the Difference?
Published:What is a Black Belt (BB)? A Six Sigma Black Belt (BB) is a professional who has achieved a high level of expertise in the Six Sigma methodology. Six Sigma is a disciplined, data-driven approach to process improvement that aims to eliminate defects and improve the quality and efficiency of business processes. The Benefits of […]
Read more
Quality Control vs. Quality Assurance: What’s the Difference?
Updated:What is Quality Control (QC)? Quality control (QC) is a product-oriented approach to quality to ensure that products or services meet specified quality requirements and standards. Quality control focuses on inspection and testing to verify that a product is safe and effective after production. It is often viewed as a process of detection versus prevention. […]
Read more
Maximizing Results with Orthogonal Regression
Updated:Have you ever wondered whether the outgoing inspection values from your vendor are equivalent to the values of your incoming inspection? Maybe it’s time to use orthogonal regression to see if one of you can stop inspecting. If your vendor is doing final outgoing inspection, do you need to also do incoming inspection on the […]
Read more
Using Queuing Theory to Improve Patient Experience and Reduce ER Wait Times
Updated:Have you or a family member ever had to visit a hospital Emergency Room? What was your experience? How was your wait time? Let’s see how one hospital handled long wait times and extensive patient dissatisfaction using queuing theory. The Emergency Room of a public hospital was experiencing long wait times to treat patients. Wait […]
Read more
Determining Total Cost of Quality Can Improve Your Business Processes
Updated:You are probably familiar with the notion that there are costs of poor quality, often shown as COPQ. These represent both internal and external failures to maintain good quality. There are also costs associated with maintaining good quality sometimes represented as COGQ. These costs represent appraisal and prevention costs. Total Cost of Quality (TCOQ) is […]
Read more
Blended Learning
Updated:What are you blending when you speak about blended learning? You are combining face to face classroom learning with an instructor and online or computer driven learning. Let’s learn a little more about this concept of learning. In the 1960’s, technology-based training emerged as an alternative to instructor-led training. One of the major advantages of […]
Read more
What are Transformations? A Complete Guide
Updated:Many statistical tools assume normality. Is there an option if my data is not normal? Transforming your data might help. Some statistical methods, such as hypothesis testing, have an underlying assumption of the normality of your data before they can be used. Although control charts are generally robust to normality issues, sometimes the data is […]
Read more
Sampling
Updated:It is often not possible or practical to collect all the data from your process. It can be too costly or take too much time. It may not be possible to access all the data. If this situation exists in your process, then you will need to sample your data. Overview: What is sampling? There […]
Read more
Levels
Updated:The term levels is used in the context of Design of Experiments (DOE) and refers to the different settings you can use for running your experiments. Let’s look at this in a little more detail. The purpose of doing a Design of Experiments (DOE) is to identify what variables or factors have a causal effect […]
Read more
Champion
Updated:When an organization attempts to implement a Six Sigma deployment, somebody needs to be selected to lead and manage it. Champions are upper-level managers who lead the execution of the Six Sigma deployment plans for the organization. That makes it one of the most critical roles in the eventual success of your Lean Six Sigma […]
Read more
The Ultimate Cheat Sheet for Mastering Binomial Distribution
Updated:A binomial distribution can be described as the probability of a binary outcome in an activity that is repeated multiple times. It is a distribution of discrete data rather than continuous data. For example, a coin toss has only two possible discrete outcomes: heads or tails. Inspecting and testing a manufactured part can have two […]
Read more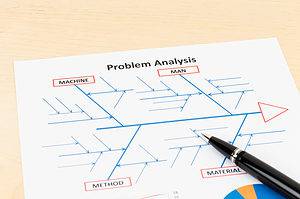
The Dos and Don’ts of Conducting Root Cause Analysis
Updated:In the context of Six Sigma and Continuous Improvement, a root cause is defined as an issue or factor that causes a nonconformance or defect which, if eliminated, will improve the process. The root cause is the base issue which sets a cause-and-effect reaction in motion eventually resulting in a problem. Overview: What is root […]
Read more
What You Need to Know About ISO 9000 Series of Standards
Updated:ISO 9000 is a series of standards, developed and published by the International Organization for Standardization (ISO). It defines, establishes, and maintains an effective quality management system for manufacturing and service industries. Overview: What is the ISO 9000 series? ISO 9000 is a series of individual standards. The core standards contained within the series are: […]
Read more
Make Informed Decisions with Quantitative Data
Updated:There are two broad categories of data in statistics: quantitative data and categorical data. Quantitative data is something you measure or count while categorical data presents data in categories or groups rather than the actual values themselves. Overview: What is quantitative data? Quantitative data describe values and numbers which are measured or counted and can […]
Read more
Quality Management
Updated:The strategy of continuously improving your organizational processes by setting your goals, identifying deviations from those goals, and then taking appropriate actions to adjust your processes to close the gaps.
Read more
Non-Parametric Test
Updated:Tests that do not require a specific distribution to be valid.
Read more