Follow Me On:

What The Hawthorne Effect Teaches Us About Motivating Workers
Updated:Have you ever noticed that, when you observe people doing their job, they may alter the way they work if they know you are looking? That sums up the essence of the Hawthorne Effect.
Read more
Binomial Random Variables: A Guide to Calculating Probabilities
Updated:You might be familiar with a continuous random variable where you can measure something with an infinite number of possible values. But what if your data has only two possible values; good or bad? Maybe we can answer that with a discussion of a binomial random variable.
Read more
The Science Behind Box Plot Whiskers
Updated:Overview: What is a whisker? We need to do a quick review of a box plot before discussing a whisker. The box plot, also referred to as a box and whiskers plot, was introduced in 1970 by American statistician, Dr. John Tukey. A box plot consists of two parts, a box, and a set of […]
Read more
The Impact of Lurking Variables: Why Ignoring Them Can be Costly
Updated:You just did some statistical analysis, but your results don’t make sense to you. Did you capture all the variables you needed or is there something you missed? Maybe there is a lurking variable.
Read more
Understanding Range: What it is and What it isn’t
Updated:The three descriptors that can be used to describe the variation or dispersion of your data are the standard deviation, variance and range. The range is the easiest to calculate, but not the most useful in describing the variation of your data.
Read more
Expert Tips and Tricks for Using Pareto Charts in Your Data Analysis
Updated:You have probably heard of the Pareto Principle and used a Pareto Chart. Since it is one of the 7 QC Tools, let’s explore this topic in a little more detail.
Read more
Breaking Down What You Need to Know About Main Effects
Updated:If you wanted to improve the gas mileage of your car, what factors would you look at to do that? How would you measure the impact or effect of those factors? Computing the main effect could answer your question.
Read more
What is the Median and Why is it Important in Statistics?
Updated:The median strip in the road runs down the middle so half the road is on one side and the other half on the other side. Does the statistical median do the same thing?
Read more
Lean Six Sigma Certification Levels
Updated:Dr. Mikel Harry is often credited with adapting the martial art concept of belt rankings to Lean Six Sigma (LSS). The hierarchy of belts indicates the level of training, competency, and acquisition of skills. While different organizations may have different names and colors for the levels of expertise in LSS, the following represents the most […]
Read more
Lean Six Sigma Champion Training and Certification
Published:The rock band, Queen, celebrated Champions with these lyrics; “We are the champions…. my friends….And we’ll keep on fighting ’til the end….We are the champions….We are the champions….No time for losers….’Cause we are the champions….Of the world.” Lean Six Sigma also has its Champions. Let’s learn more about them. Role of the Champion While Lean […]
Read more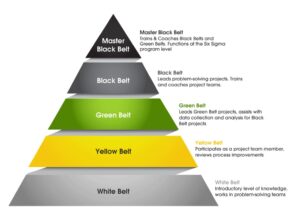
Lean Six Sigma Master Black Belt training and certification
Published:Does the term Master Black Belt sound pretty impressive? It should, because it is the highest level of achievement and expertise in Lean Six Sigma. Let’s explore the role of a Lean Six Sigma Master Black Belt and how you can attain that pinnacle of success. Role of the Master Black Belt As you can […]
Read more
Lean Six Sigma Black Belt Training and Certification
Published:Will having a Lean Six Sigma Black Belt allow you to break bricks and beat up other people? Probably not, but it will help you remove waste, analyze data and improve processes in your organization. Let’s see what a Lean Six Sigma Black Belt does and how you can become one. Role of the Black […]
Read more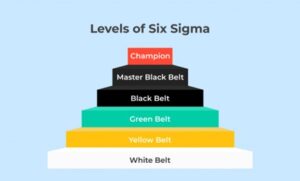
Lean Six Sigma Green Belt Training and Certification
Published:Lean Six Sigma Green Belt is where your more advanced training and certification begins. If you are already a White or Yellow Belt, you have learned some of the basic concepts of Lean Six Sigma. Green Belt is where your learning really takes off. Role of the Green Belt The hierarchy of Lean Six Sigma […]
Read more
Lean Six Sigma White Belt Training and Certification
Published:You are ready to start your Lean Six Sigma journey but where do you start? White Belt training and certification is the entry point into learning about Lean Six Sigma. Lean Six Sigma White Belt training and certification If your organization is deploying a Lean Six Sigma (LSS) initiative, and you can participate in White […]
Read more
Lean Six Sigma Training and Certification
Published:Organizations have been deploying and implementing Lean Six Sigma for decades. Yet, there are still many questions on how someone can get formally trained and certified in the tools, methodologies and philosophy of Lean Six Sigma. This article will be the first in a series to answer some of the most common questions about Lean […]
Read more
Lean Six Sigma Yellow Belt training and certification
Published:After completing your training and certification for White Belt, your next step might be to advance to Yellow Belt training and certification. Let’s see what’s involved with that. Lean Six Sigma Yellow Belt training and certification As a Lean Six Sigma (LSS) Yellow Belt (YB), you will gain some basic knowledge and learn some skills […]
Read more
What is the Best Lean Six Sigma Training and Certification?
Published:Getting recommendations from others for your Lean Six Sigma training and certification is a good strategy. But given all the variation in available programs, it is a good idea to have a list of criteria to compare your recommendations. Here is a list to get you started. What is the best Lean Six Sigma training […]
Read more
What is the Impact on my Compensation if I am Lean Six Sigma Trained and Certified?
Published:Taking Lean Six Sigma training and getting certified will cost you time and money. Is it worth it? Will you earn more money with the additional credential of a Lean Six Sigma belt? Let’s check it out.
Read more
What is the Cost of Lean Six Sigma Training and Certification?
Published:If you are being Lean Six Sigma trained and certified by your employer, the cost should not be a concern for you. But what if you must pay for it by yourself? Cost may then be important. Let’s explore the variation in cost for being LSS trained and certified.
Read more
Lean Six Sigma Training and Certification: Online or in Person?
Updated:Do you like to take classes in a physical classroom or virtually on a computer? This is a significant decision since Lean Six Sigma training and certification can be achieved either way. Let’s examine the plus and minus of each format.
Read more
Why is Lean Six Sigma Accredited Training and Certification Important?
Published:Would you be happy if your doctor received her MD from an unknown and unaccredited medical school? Probably not. What about your CPA or attorney? Again, probably not. For the same reason, your employer wouldn’t be happy with your Lean Six Sigma certification if it was awarded by an unknown organization with a poor reputation […]
Read more
What is Lean Six Sigma Training and Certification?
Published:There are two steps to earn a martial arts belt. First, you must be trained in the various techniques and then you must demonstrate your skills and knowledge. The same holds true for Lean Six Sigma training and certification. Let’s learn a little more. What is Lean Six Sigma training and certification? In martial arts, […]
Read moreHow Can I Get Lean Six Sigma Trained and Certified?
Published:When there are too many items on a menu you can get confused by the variety of choices. Getting Lean Six Sigma trained and certified can also be confusing. Let’s discuss some of your options.
Read more
Practical Application of Contingency Tables in Industry
Updated:If you suspected there was a relationship between your customer’s experience with your product and their future buying tendency, how would you go about confirming whether a relationship existed or not?
Read more