isixsigma.com

DMAIC Helps Miami-Dade Public Library Improve Services and Save Money
Updated:In 2018, the Miami-Dade Public Library System utilized Six Sigma methodology to improve upon the time needed for the transporting of library materials. The utilization of Six Sigma to meet the needs of this type of organization is an exciting example of just how versatile these tools can be. When we go to the library, […]
Read more »
How Six Sigma and the DMAIC Process Made Samsung Into an Industry Leader
Updated:With strategic implementation, Six Sigma can do wonders for an organization. The methodology can drastically improve processes, cut down on waste, and even help provide better results in the design and R&D of new products. Samsung found that it was having issues with all of the above and, in 1999, conducted a complete overhaul of […]
Read more »
How Canon Business Process Services Uses Six Sigma to Optimize Business Processes
Updated:Everyone knows Canon as a massive corporation that manufactures cameras, printers, scanners, and a variety of other quality goods. Less known by the consumer market is the role Canon plays in helping other companies improve processes using the Six Sigma methodology. This happens through a Canon subsidiary that operates under the name Canon Business Process […]
Read more »
How the Six Sigma Voice of the Customer and DMAIC Tools Brought the Two Sides of SQL Together
Published:With the formation of a joint venture between the original healthcare organization laboratory, Sonora Lab, and the larger Quest Diagnostics, a partnership existed in name only. Both labs went about operating in separate locations while continuing with their individual instrumentation and systems. Over time, this led to issues across both teams, and it became clear […]
Read more »
How Six Sigma and Lean Tools Helped Recover Nearly 4 Million Dollars in Annual Revenue
Updated:When faced with the news that drug manufacturers of cancer medication were responsible for causing a massive amount of financial waste, the oncology department at UCSD utilized Six Sigma and Lean tools like a cause-and-effect diagram, a Kaizen Event, the 5 Whys, and others in order to improve scanning processes that could help in recovering […]
Read more »
How Six Sigma Tools Sharply Decreased Downtime At The Nature Conservancy’s Headquarters
Updated:The web development team at The Nature Conservancy in Arlington, VA, was able to utilize Lean and Six Sigma tools to close the gap in downtime due to a coding freeze every 45 days. The Nature Conservancy used such Six Sigma tools as process maps, The 5 Whys, and cause-and-effect diagrams to dramatically bring the […]
Read more »
How Listening to the Voice of the Customer Led to a Significant Drop in Hospital Wait Times
Updated:In the emergency department of a hospital, the amount of wait time is of huge importance to the patient as well as the staff. Using Six Sigma methodology, the nurse director of Providence Hospital in Michigan was able to dramatically cut down on wait times for patients. Before Providence Hospital in Southfield, MI, embarked on […]
Read more »
Lean Six Sigma Saves U.S. Army Test Center Millions
Updated:By employing Six Sigma and Lean Six Sigma methodologies, the U.S. Army’s Aberdeen Test Center was able to improve the cost-effectiveness and efficiency of its vehicle maintenance operations. Six Sigma’s DMAIC method gave the Aberdeen Test Center the necessary tool for improving its cycle time, significantly decreasing the wait for its clients between when a […]
Read more »
Maximizing Results with Orthogonal Regression
Updated:Have you ever wondered whether the outgoing inspection values from your vendor are equivalent to the values of your incoming inspection? Maybe it’s time to use orthogonal regression to see if one of you can stop inspecting. If your vendor is doing final outgoing inspection, do you need to also do incoming inspection on the […]
Read more »
How Utilizing the Full Six Sigma Process Helped Turn Wipro Into a Global IT Leader
Updated:In the 1980s, Wipro made the leap from being primarily known as a vegetable oil company in India into the world of IT. In order to be a competitor in this industry on a global scale, Wipro would need to continually improve its performance as well as work smarter towards meeting the needs of its […]
Read more »
How DMAIC Helped a Small Company Increase Total Annual Sales by Nearly $250,000
Published:There are plenty of available case studies when it comes to how large corporations have integrated Six Sigma methodologies into their organizations. Less attention has been paid to the smaller and medium-sized companies that embrace Six Sigma. Can the same kind of success that big business garners from Six Sigma methodology translate to much smaller […]
Read more »
Using Queuing Theory to Improve Patient Experience and Reduce ER Wait Times
Updated:Have you or a family member ever had to visit a hospital Emergency Room? What was your experience? How was your wait time? Let’s see how one hospital handled long wait times and extensive patient dissatisfaction using queuing theory. The Emergency Room of a public hospital was experiencing long wait times to treat patients. Wait […]
Read more »
How Green Belt Certification and DMAIC Improved Help Desk Resolution Time By 64%
Updated:Lean and Six Sigma practices are ultimately about helping businesses use efficiency to provide the ultimate customer experience. But what about state and county government entities? Can the same practices apply, and do they even have “customers”? The residents in the counties these government offices serve would likely say “yes”. Kern County spans the southern […]
Read more »
Continuous Improvement and the 3p Approach Helped Deschutes Become An Industry Leader
Published:You may have taken notice of Deschutes lately. In the last few years, it has become much more commonplace to find the brewery’s products on draft at your local pub or at your nearest retailer. Such a marketplace presence did not happen overnight, and the brewery credits the lessons learned from Six Sigma as having […]
Read more »
How ZARA Revolutionized the Fashion Industry with Lean Practices
Updated:ZARA changes its clothing designs every two weeks on average, offering upwards of 11,000 distinct garments every year. In comparison, competitors change their designs every three or four months and product 3-4,000 distinct pieces. This is fast fashion: the business model of replicating high-fashion, luxury-brand pieces quickly and cheaply, making them available to customers while […]
Read more »
DMAIC Helped Coca-Cola Revamp Call Centers and Improve Sales
Updated:In 1985, Coca-Cola embarked on what has since been viewed as one of the worst marketing blunders in history. The customer response as well as how Coca-Cola decided to reformat how it dealt with customers, informed how the beverage company would modify its processes for decades to come. When Coca-Cola discontinued its original formula and […]
Read more »
Lean Six Sigma Improved the Efficiency of a Growing Business
Updated:On the Success Stories podcast with Marshall Atkinson, Ali Banholzer of Wear Your Spirit Warehouse discussed how Lean Six Sigma was utilized to increase profit margins for her company as she worked towards achieving a Six Sigma Black Belt. When a small business goes through a period of growth, it can become painfully clear that […]
Read more »
How to Track and Improve Customer Expectations Using Result Measurables
Updated:Measurables indicate how a process is performing or how customer expectations are being met. These indicators are quantifiable, expressed numerically, and can have units of measurement. There are two kinds of these indicators. They are process measurables and result measurables. It is important in any business to know if you are meeting the expectations of […]
Read more »
Y
Updated:In discussions about the Six Sigma methodology, you will often find the equation Y=F(x). It is an important formula in working with the methodology and can serve as a very helpful tool in project management. When working with the Y=f(x) formula, X stands for the various inputs utilized to generate an outcome, while f represents […]
Read more »
TEAM
Updated:When you are part of an organization that is working towards goals, you are part of a team. A team moving toward hitting milestones can sometimes need to generate excitement and motivation while inching toward the goal line. This is why we have acronyms like TEAM. An acronym like TEAM can be used by team […]
Read more »
Randomization: Key to Reducing Bias and Increasing Accuracy
Updated:Not all experiments are created equal. Learn how randomization can improve the validity of any business’ experiments aligned with Six Sigma principles. Randomization in Six Sigma Business owners and managers want to know what works and what doesn’t when it comes to existing processes and methods of operation. Running experiments and assigning inputs and outputs […]
Read more »
How Total Quality Management Got Xerox Back on Track
Updated:Xerox went from being an industry leader to resting on its laurels. Their focus shifted away from improvement for the benefit of their customers. This, coupled with a financial scandal, brought the organization to the point where many financial experts believed that bankruptcy was on the horizon. A major shift in how Xerox did business […]
Read more »
How Simple Linear Regression Helps Make Sense of Data
Updated:What is the point of having a bunch of raw data if you don’t have the tools to analyze it? Regression models provide you with the ability to see if there is a relationship between two types of variables, helping make some sense of data that has been collected by fitting it to a line. […]
Read more »
Tukey’s (1-way ANOVA)
Updated:ANOVA will tell you whether there is a statistically significant difference in the population means of three or more groups of data. But which means are different? Tukey’s will tell you that. Analysis of Variance (ANOVA) is used to determine whether the population means of several sample data sets are statistically different or not. If […]
Read more »
How a Drone Project Increased Efficiency and Eliminated Waste
Updated:Arrow Electronics had already been utilizing Six Sigma practices when it introduced its drone project in 2016 at its two main distribution centers in Malaysia and Asia. The drone project gained them further recognition for their use of Six Sigma methodology and helped usher in a new era of using drones in warehouses in the […]
Read more »
What is the Bartlett Test and How is it Used in Statistical Analysis
Updated:The Bartlett Test is named after the English statistician, Maurice Stevenson Bartlett. The test is also known as the Bartlett’s test for homogeneity of variances. It is most used in the context of doing a 1-way Analysis of Variance (ANOVA). ANOVA is used to determine whether there is any statistical difference between the means of […]
Read more »
Determining Total Cost of Quality Can Improve Your Business Processes
Updated:You are probably familiar with the notion that there are costs of poor quality, often shown as COPQ. These represent both internal and external failures to maintain good quality. There are also costs associated with maintaining good quality sometimes represented as COGQ. These costs represent appraisal and prevention costs. Total Cost of Quality (TCOQ) is […]
Read more »
Mastering the Basics: The Fundamentals of Statistics and Inference
Updated:Statistics is a branch of math that involves the collection, description, analysis, and inference of conclusions from quantitative data. But what is a statistic? Let’s find out. The word statistic is a word with numerous possible definitions. In its simplest form, a statistic can be defined as a descriptor of a set of data. The […]
Read more »
Blended Learning
Updated:What are you blending when you speak about blended learning? You are combining face to face classroom learning with an instructor and online or computer driven learning. Let’s learn a little more about this concept of learning. In the 1960’s, technology-based training emerged as an alternative to instructor-led training. One of the major advantages of […]
Read more »
Champion
Updated:When an organization attempts to implement a Six Sigma deployment, somebody needs to be selected to lead and manage it. Champions are upper-level managers who lead the execution of the Six Sigma deployment plans for the organization. That makes it one of the most critical roles in the eventual success of your Lean Six Sigma […]
Read more »
Sampling
Updated:It is often not possible or practical to collect all the data from your process. It can be too costly or take too much time. It may not be possible to access all the data. If this situation exists in your process, then you will need to sample your data. Overview: What is sampling? There […]
Read more »
Levels
Updated:The term levels is used in the context of Design of Experiments (DOE) and refers to the different settings you can use for running your experiments. Let’s look at this in a little more detail. The purpose of doing a Design of Experiments (DOE) is to identify what variables or factors have a causal effect […]
Read more »
What are Transformations? A Complete Guide
Updated:Many statistical tools have an assumption of normality. Is there an option if my data is not normal? Transforming your data might help. Some statistical methods, such as hypothesis testing, have an underlying assumption of normality of your data before they can be used. Although control charts are generally robust to normality issues, sometimes the […]
Read more »
The Ultimate Cheat Sheet for Mastering Binomial Distribution
Updated:A binomial distribution can be described as the probability of a binary outcome in an activity that is repeated multiple times. It is a distribution of discrete data rather than continuous data. For example, a coin toss has only two possible discrete outcomes: heads or tails. Inspecting and testing a manufactured part can have two […]
Read more »
The Dos and Don’ts of Conducting Root Cause Analysis
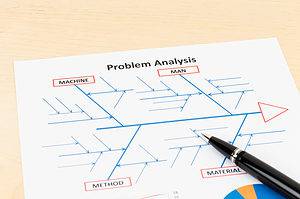
Updated:In the context of Six Sigma and Continuous Improvement, a root cause is defined as an issue or factor that causes a nonconformance or defect which, if eliminated, will improve the process. The root cause is the base issue which sets a cause-and-effect reaction in motion eventually resulting in a problem. Overview: What is root […]
Read more »
What You Need to Know About ISO 9000 Series of Standards
Updated:ISO 9000 is a series of standards, developed and published by the International Organization for Standardization (ISO). It defines, establishes, and maintains an effective quality management system for manufacturing and service industries. Overview: What is the ISO 9000 series? ISO 9000 is a series of individual standards. The core standards contained within the series are: […]
Read more »
Make Informed Decisions with Quantitative Data
Updated:There are two broad categories of data in statistics: quantitative data and categorical data. Quantitative data is something you measure or count while categorical data presents data in categories or groups rather than the actual values themselves. Overview: What is quantitative data? Quantitative data describe values and numbers which are measured or counted and can […]
Read more »
Quality Management
Updated:The strategy of continuously improving your organizational processes by setting your goals, identifying deviations from those goals, and then taking appropriate actions to adjust your processes to close the gaps.
Read more »
Quality Procrastination
Updated:Delaying quality improvement measures until the very end of a process.
Read more »
Variable
Updated:Six Sigma without variables is like a recipe without ingredients. Understanding how variables align with Six Sigma is paramount to the success of any business. Learn how variables can highlight your process’ capabilities and limitations. What are Variables in Six Sigma? Variables are essential to Six Sigma. By measuring, analyzing, and controlling the variables that […]
Read more »
Sensitivity
Updated:The degree of impact that measurable changes in input variables have on the output.
Read more »
Randomization
Updated:Randomly select factors, measurements, or variables to eliminate the effects of bias or chance.
Read more »
Queuing Theory
Updated:Queuing theory is the mathematical study of waiting in line.
Read more »
Rare Event SPC
Updated:A rare event is an occurrence that happens at such a low frequency that it cannot be monitored with traditional control charts. A rare event statistical process control chart is a tool for charting these events successfully.
Read more »
Non-Parametric Test
Updated:Tests that do not require a specific distribution to be valid.
Read more »
Interquartile Range
Updated:The difference between the first and third quartiles.
Read more »
Frequency Plot
Updated:A frequency plot is a graphical representation of the distribution of continuous data based on how often a particular value occurs.
Read more »
C-Level
Updated:A term used to describe CEO, CFO, COO, CIO, and other senior executives within an organization.
Read more »
Best Practice
Updated:When determining how to apply Six Sigma methodology to your business, you do not need to reinvent the wheel. A lot of research, testing, and work has already been put in to sort out some common best practices that are proven to work for most organizations. In any industry, there are others that have come […]
Read more »
Recommitment to Six Sigma Achieves Maximum Results
Published:Honeywell was a company that had been utilizing the Six Sigma methodology for years. Distracted by a merger and other factors, however, the organization had begun to slip. With a revitalized stake in the Six Sigma process, the organization was able to turn itself around and become even stronger than before. DMAIC and Y=f(x) Helped […]
Read more »