isixsigma.com

Benchmarking: Ten Practical Steps with Review Points
Published:Want to compare your company’s process, products or services to best-in-class practices? Follow these 10 practical benchmarking steps, complete with review questions, to provide insight into the actions the company can take to improve its performance.
Read more »
Statistical Six Sigma Definition: What It Means for Your Production Line
Published:What does it mean to be “Six Sigma”? Six Sigma at many organizations simply means a measure of quality that strives for near perfection. However, the statistical implications of a Six Sigma program go well beyond the qualitative eradication of customer-perceptible defects. It’s a methodology that is well-rooted in mathematics and statistics. What […]
Read more »
Why SIPOC Diagrams Are Crucial for Lean Six Sigma Projects
Updated:Why should you start a SIPOC diagram at the start of your Lean Six Sigma Projects? Many facets go into planning and executing a project. The last few years have seen the rise of software-centric methodologies like Agile and DevOps, which have become prominent outside of the tech industry. However, SIPOC diagrams remain […]
Read more »
Skewness in Data: What It Is and How to Interpret It
Published:When someone says your data is skewed, do you get upset? Skewness can be a natural state of your data. Let’s find out more about skewness and what it means.
Read more »
Can AI Replace Lean Six Sigma Master Black Belts?
Updated:Artificial Intelligence (AI) is revolutionizing industries worldwide, reshaping everything from customer service to manufacturing, and sparking questions about its potential to replace skilled professionals. Within quality management, particularly Lean Six Sigma (LSS), many wonder if AI could ultimately replace the role of a Lean Six Sigma Master Black Belt (MBB). As the highest level of […]
Read more »
Can AI Be Used to Replace Six Sigma Statistical Software?
Published:Key Concepts Six Sigma is a well-established, data-driven methodology designed to improve processes by identifying and eliminating defects in manufacturing and business processes. One of the key components of Six Sigma is statistical analysis, which helps organizations identify problems and implement solutions. To perform this analysis, Six Sigma practitioners traditionally rely on specialized statistical software, […]
Read more »
Achieving Process Stability with Common Cause Variation: Strategies for Success
Published:This article will introduce you to common cause variation, one of the foundational concepts in quality improvement. We’ll explore guidance for the successful use of common cause variation in process improvement.
Read more »
How to Use Entitlement to Drive Process Improvement
Published:Entitlement is defined as the best performance you can reasonably achieve with the existing process.
Read more »
Mean in Lean Six Sigma: How to Interpret Your Data
Published:Central tendency and mean are two of the more significant statistics that are used in Lean Six Sigma. These two concepts have a large place in the developed world of LSS and are important when it comes to implementing new technologies or measuring processes for improvement.
Read more »
Low-Hanging Fruit: Easily Transform Your Organization
Published:A competitive and successful business needs to critically evaluate all the opportunities for improvement and deploy valuable resources strategically. By identifying low-hanging fruit, high-impact, low-effort activities can be addressed creating a solid foundation for continuous improvement.
Read more »
Insights from COPIS for Improved Efficiency
Published:What does your process look like from 30,000 feet? Your extended process view can be described using COPIS, or customer, output, process, input, and supplier. Let’s get in our balloon and go up.
Read more »
Subjective Rating vs. Ranking: Which Is the Better Data Collection Method?
Published:Subjective ratings and rankings can be used in a variety of applications, such as assessing job performance, gauging customer satisfaction, and monitoring the morale of your workforce. Find out more about this Six Sigma term.
Read more »
The FabChip Caster Challenge: A Lean Six Sigma Journey To $3,000,000
Published:Background FabChip (fictitious name) was a leader in the global semiconductor industry, known for its cutting-edge wafer-fabrication equipment. With the semiconductor sector at the core of everything from smartphones to medical devices, FabChip’s role in supplying this vital technology was crucial. The equipment FabChip manufactured, however, was often large and complex. When it arrived at […]
Read more »
Best Practices for Managing Rework in Your Business
Published:Increasing complexity of products and services in combination with the pressure of reduced time to market can increase the probability of non-conformance and the need to perform rework to meet functional requirements. We’ll explain why avoiding rework activities is an all-round winner with some top tips for you to implement it in your business.
Read more »
TEAM: Meeting Your Project Goals
Published:When you are part of an organization that is working towards goals, you are part of a team. A team moving toward hitting milestones can sometimes need to generate excitement and motivation while inching toward the goal line. This is why we have acronyms like TEAM. An acronym like TEAM can be used […]
Read more »
Assessing Process Stability: Techniques and Tools
Published:Have you ever wondered why your doctor may keep you waiting in the waiting room or why you have to fast before doing a blood test? Let’s see if Lean Six Sigma can give you an answer.
Read more »
Process Stability: Minimizing Variation While Increasing Efficiency
Published:In Six Sigma, process stability is extremely important to efficiency and productivity. With a stable process, you have predictability, and quotas can be met.
Read more »
Understanding Process Variation: Increasing Production Quality
Published:It is well established that there exist eight dimensions of quality: Each dimension can be explicitly defined and is self-exclusive from the other dimensions of quality. A customer may rate your service or product high in conformance, but low in reliability. Or they may view two dimensions to work in conjunction with each […]
Read more »
Bimodal Distributions and Why They Matter
Published:One of the important statistical descriptors of your data is its central tendency. Central tendency can be described using the mean, median and mode of the data. The mean is described as the mathematical center of your data. The median is the physical center of your data, and the mode is the most frequently occurring value in your data.
Read more »
PDCA vs. OODA: What’s the Difference?
Published:What Is PDCA? The Plan-Do-Check-Act (PDCA) method is a framework used to achieve continuous improvement in a particular organization or process. It’s also known by several other names, including the Deming wheel, the Shewhart cycle, and the control circle. Even though the method was originally rooted in quality control, it has since been […]
Read more »
Tips for Recognizing and Transforming Non-Normal Data
Published:Six Sigma professionals should be familiar with normally distributed processes: the characteristic bell-shaped curve that is symmetrical about the mean, with tails approaching plus and minus infinity (Figure 1). When data fits a normal distribution, practitioners can make statements about the population using common analytical techniques, including control charts and capability indices (such […]
Read more »
ARMI (Approver, Resource, Member, Interested Party): Mastering Lean Six Sigma
Updated:ARMI stands for Approver, Resource, Member, and Interested Party (IP). Find out more about these Lean Six Sigma expertise classifications.
Read more »
15 Criteria for Selecting a Viable DMAIC Project
Published:As anyone involved in Six Sigma knows, selecting the right project is a critical component of project success. If practitioners do not put enough effort into selecting the right opportunity for improvement, a project can end in disaster, or create unnecessary work and complexity for the project team. Selecting projects with just a […]
Read more »
Understanding the Uses for Mood’s Median Test
Published:When comparing the average of two or more groups with the help of hypothesis tests, the assumption is that the data is a sample from a normally distributed population. That is why hypothesis tests such as the t-test, paired t-test, and analysis of variance (ANOVA) are also called parametric tests. Nonparametric tests do […]
Read more »
The Benefits of Using Flowcharts in Six Sigma Projects
Published:A flowchart is a diagram of a process, using standard symbols to represent a variety of process activities over a specified timeline.
Read more »
Continuous vs. Attribute Data: What’s the Difference?
Published:What is Continuous? Continuous data refers to numerical data with any value within a certain range. The values have infinite possibilities, but they all fall within a range. These can be whole numbers or decimals measured using data analysis like skews and line graphs. This kind of data can change over time and […]
Read more »
A Practical Approach to the Successful Practice of 5S
Published:While some Lean Six Sigma (LSS) practitioners consider 5S a tool, it is more than that. 5S, abbreviated from the Japanese words seiri, seito, seiso, seiketsu, shitsuke, is not just a methodology, it is a culture that has to be built into any organization that aims for spontaneous and continuous improvement of working […]
Read more »
Steps in Constructing an X-Bar and R-Control Chart
Published:Steps in Constructing an X-Bar and R Control Chart: This document contains the step-by-step instructions to construct an X-bar and R control chart. First the R chart is constructed. If the R chart validates that the process variation is in statistical control, the XBAR chart is constructed.
Read more »
Process Entitlement: Unlocking Top Process Performance
Published:Understanding process entitlement is essential to Lean Six Sigma practitioners and organization leaders because process entitlement quantifies the best case or optimum process performance without changes to the process.
Read more »
Thought Process Map for Six Sigma: What, Why and How
Published:A thought process map, sometimes referred to as a TMAP or TPM, not only helps you begin an improvement project with a comprehensive view, but ensures you stay on track all the way through completion. Learn how to use this powerful visual tool.
Read more »
Multi-Vari Chart: Visualizing Variation in Your Processes
Published:As the Chinese proverb says, “a picture is worth a thousand words.” The multi-vari chart is such a picture. In a single graph, you will be able to understand the variation of your process. Let’s learn more.
Read more »
Gemba: The Key to Engaging Employees and Improving Performance
Published:Does Going to Gemba sound like a nice trip to an exotic locale? While not a fancy foreign destination, Gemba is going to where the work is done to learn more about the process. Let’s take a deeper look into what Gemba is about.
Read more »
The Harada Method: Reduce the Eighth Waste – Part 1 of 2
Updated:The Harada method helps individuals achieve self-reliance, which in turn facilitates a company’s process improvement journey. This week’s article provides an overview of the method and its genesis. Part Two of this article presents five templates to use to plan a goal, measure the goal’s progress, and assess success. No matter its size, an organization is driven by […]
Read more »
Comparing and Contrasting AI, CI and Big Data
Published:AI (Artificial Intelligence) involves creating systems and algorithms capable of mimicking human intelligence to perform tasks like decision-making, problem-solving, and pattern recognition. It leverages techniques such as machine learning and neural networks to improve through experience. Continuous improvement focuses on systematically enhancing processes, products, or services through incremental changes, using methods like Lean […]
Read more »
Real Life Examples of Quality Management That Worked
Updated:Quality management is the process of ensuring that products and services meet consistent standards of excellence. It encompasses various strategies, tools, and techniques that aim to enhance organizational performance, improve customer satisfaction, and reduce waste. Many businesses around the world have effectively utilized quality management principles to drive significant improvements. Over the years there have […]
Read more »
Effective Project Management with SMART Goals
Published:You need to be SMART when writing the goals for your project charter: specific, measurable, achievable, relevant, and time-bound. Here’s how the SMART framework can help you write better goal statements.
Read more »
Exploring the Benefits of Fractional Factorial DOE
Published:Fractional factorial DOE is a cost- and time-effective designed experimentation statistical tool for understanding the impact of your process inputs on your process outputs.
Read more »
Suppliers, Inputs, Process, Output, Customers (SIPOC): Powerful Visualization
Published:What does your process look like from 25,000 feet up in the air? Your extended process view can be described using SIPOC, or supplier, input, process, output, and customer. Let’s get in our plane and go up.
Read more »
Three Steps for Aligning Projects to Business Priorities
Published:A company with a Six Sigma deployment identifies a process improvement area within the business. It is easy to figure out what comes next – just define the problem, set the goal, select the project team, pick the team leader, and get out of the way, right? Well, sort of…but before deployment leaders get […]
Read more »Center Points: Finding the Mathematical Center of Your Data
Published:The use of center points in your designed experiments can be valuable in determining the actual relationship between your input factors and your response variable. Let’s explain this in a little more detail.
Read more »
Understanding the Purpose and Use of Benchmarking:
Published:Benchmarking is a way of discovering what is the best performance being achieved – whether in a particular company, by a competitor, or by an entirely different industry. This information can then be used to identify gaps in an organization’s processes to achieve a competitive advantage. Thus it is important for Six Sigma practitioners […]
Read more »
What is the Bartlett Test and How is it Used in Statistical Analysis
Published:The Bartlett Test is named after the English statistician, Maurice Stevenson Bartlett. The test is also known as the Bartlett’s test for homogeneity of variances. It is most used in doing a 1-way Analysis of Variance (ANOVA). ANOVA is used to determine whether there is any statistical difference between the means of three […]
Read more »
Understanding Customer Needs: The Importance of Quality Targets
Published:Understanding what quality targets are and how to center product uniformity around them is a helpful step in overall process improvement, ultimately leading to increased profits and customer satisfaction rates.
Read more »
Containment Best Practices: Ensuring Product Integrity
Published:If you have a non-conforming or defective product coming off your production line, what do you do with it? Utilizing a strategy of containment might be the way to go. Let’s learn more about this. Containment of non-conforming products refers to the actions you take to prevent the distribution or use of products […]
Read more »Tolerance Range: Expecting Variation in Your Data
Published:Understanding and determining the upper and lower statistical limits are the key to determining tolerance range (TR). Find out more about this LSS concept.
Read more »
Corrective Action: Eliminating Nonconformity Permanently
Published:Corrective action is the process, known as a corrective action plan (CAP), of taking the appropriate steps to identify the root cause of a problem and implementing a solution that corrects the root cause to prevent its recurrence. The aim is to improve the processes in place within an organization so that problems […]
Read more »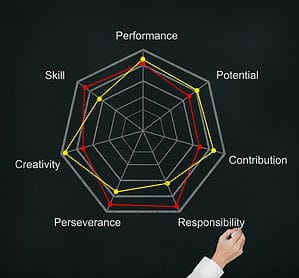
Radar Charts: The Visual Tool for Multi-Dimensional Data Comparison
Published:A radar chart, also known as a spider chart, is a great tool to graphically compare multiple outcomes for specific characteristics and criteria.
Read more »
Cause-and-Effect Diagrams: A Visual Tool for Root Cause Analysis
Published:Getting to grips with the many different causes of defects and quality issues is key to ensuring business success and avoiding customer dissatisfaction. The cause and effect diagram is a clear, visual representation of all possible causes and keeps the team focused upon quality improvement.
Read more »
Monitoring Process Performance with X-Bar and R Charts
Published:Is the variation in your process data to be expected, or has something special occurred? A control chart will give you the answer. The X-bar and R chart will give you the details.
Read more »
The Importance of Fisher’s (1-way ANOVA) in Statistical Analysis
Published:Fisher’s 1-way ANOVA is a classic analysis of variance utilized in statistics to determine if there are statistical differences between the means of two or more unrelated groups.
Read more »